
- PREMIUM
- LIVE QUOTES
- INSTITUTIONS
 Index Options
 State Street
 CME Group
 Nasdaq
 Cboe
Cboe TradingView
 Wall Street Journal
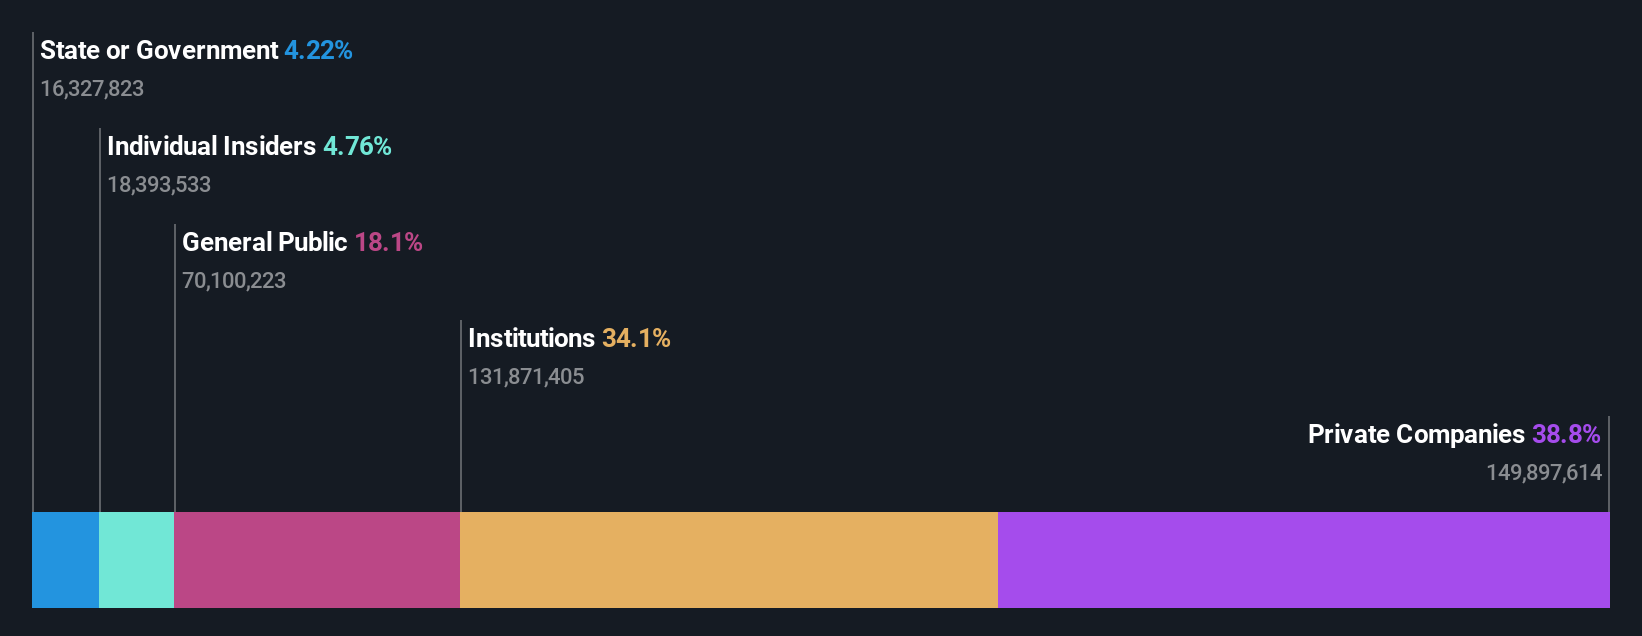
Institutions own 34% of InterGlobe Aviation Limited (NSE:INDIGO) shares but private companies control 39% of the company
Key Insights
- InterGlobe Aviation's significant private companies ownership suggests that the key decisions are influenced by shareholders from the larger public
- 52% of the business is held by the top 5 shareholders
- 34% of InterGlobe Aviation is held by Institutions
To get a sense of who is truly in control of InterGlobe Aviation Limited (NSE:INDIGO), it is important to understand the ownership structure of the business. The group holding the most number of shares in the company, around 39% to be precise, is private companies. In other words, the group stands to gain the most (or lose the most) from their investment into the company.
Meanwhile, institutions make up 34% of the company’s shareholders. Insiders often own a large chunk of younger, smaller, companies while huge companies tend to have institutions as shareholders.
Let's take a closer look to see what the different types of shareholders can tell us about InterGlobe Aviation.
Check out our latest analysis for InterGlobe Aviation
What Does The Institutional Ownership Tell Us About InterGlobe Aviation?
Many institutions measure their performance against an index that approximates the local market. So they usually pay more attention to companies that are included in major indices.
We can see that InterGlobe Aviation does have institutional investors; and they hold a good portion of the company's stock. This implies the analysts working for those institutions have looked at the stock and they like it. But just like anyone else, they could be wrong. When multiple institutions own a stock, there's always a risk that they are in a 'crowded trade'. When such a trade goes wrong, multiple parties may compete to sell stock fast. This risk is higher in a company without a history of growth. You can see InterGlobe Aviation's historic earnings and revenue below, but keep in mind there's always more to the story.

InterGlobe Aviation is not owned by hedge funds. Our data shows that Acquire Services Private Limited is the largest shareholder with 36% of shares outstanding. For context, the second largest shareholder holds about 5.1% of the shares outstanding, followed by an ownership of 4.7% by the third-largest shareholder.
To make our study more interesting, we found that the top 5 shareholders control more than half of the company which implies that this group has considerable sway over the company's decision-making.
While it makes sense to study institutional ownership data for a company, it also makes sense to study analyst sentiments to know which way the wind is blowing. There are a reasonable number of analysts covering the stock, so it might be useful to find out their aggregate view on the future.
Insider Ownership Of InterGlobe Aviation
The definition of company insiders can be subjective and does vary between jurisdictions. Our data reflects individual insiders, capturing board members at the very least. Company management run the business, but the CEO will answer to the board, even if he or she is a member of it.
Most consider insider ownership a positive because it can indicate the board is well aligned with other shareholders. However, on some occasions too much power is concentrated within this group.
Shareholders would probably be interested to learn that insiders own shares in InterGlobe Aviation Limited. The insiders have a meaningful stake worth ₹92b. It is good to see this level of investment. You can check here to see if those insiders have been buying recently.
General Public Ownership
The general public-- including retail investors -- own 18% stake in the company, and hence can't easily be ignored. While this size of ownership may not be enough to sway a policy decision in their favour, they can still make a collective impact on company policies.
Private Company Ownership
We can see that Private Companies own 39%, of the shares on issue. It might be worth looking deeper into this. If related parties, such as insiders, have an interest in one of these private companies, that should be disclosed in the annual report. Private companies may also have a strategic interest in the company.
Next Steps:
I find it very interesting to look at who exactly owns a company. But to truly gain insight, we need to consider other information, too. For example, we've discovered 2 warning signs for InterGlobe Aviation that you should be aware of before investing here.
Ultimately the future is most important. You can access this free report on analyst forecasts for the company.
NB: Figures in this article are calculated using data from the last twelve months, which refer to the 12-month period ending on the last date of the month the financial statement is dated. This may not be consistent with full year annual report figures.
Have feedback on this article? Concerned about the content? Get in touch with us directly. Alternatively, email editorial-team (at) simplywallst.com.
This article by Simply Wall St is general in nature. We provide commentary based on historical data and analyst forecasts only using an unbiased methodology and our articles are not intended to be financial advice. It does not constitute a recommendation to buy or sell any stock, and does not take account of your objectives, or your financial situation. We aim to bring you long-term focused analysis driven by fundamental data. Note that our analysis may not factor in the latest price-sensitive company announcements or qualitative material. Simply Wall St has no position in any stocks mentioned.