
- PREMIUM
- LIVE QUOTES
- INSTITUTIONS
 Index Options
 State Street
 CME Group
 Nasdaq
 Cboe
Cboe TradingView
 Wall Street Journal
OC Oerlikon Corporation AG (VTX:OERL) Shares Could Be 22% Above Their Intrinsic Value Estimate
Key Insights
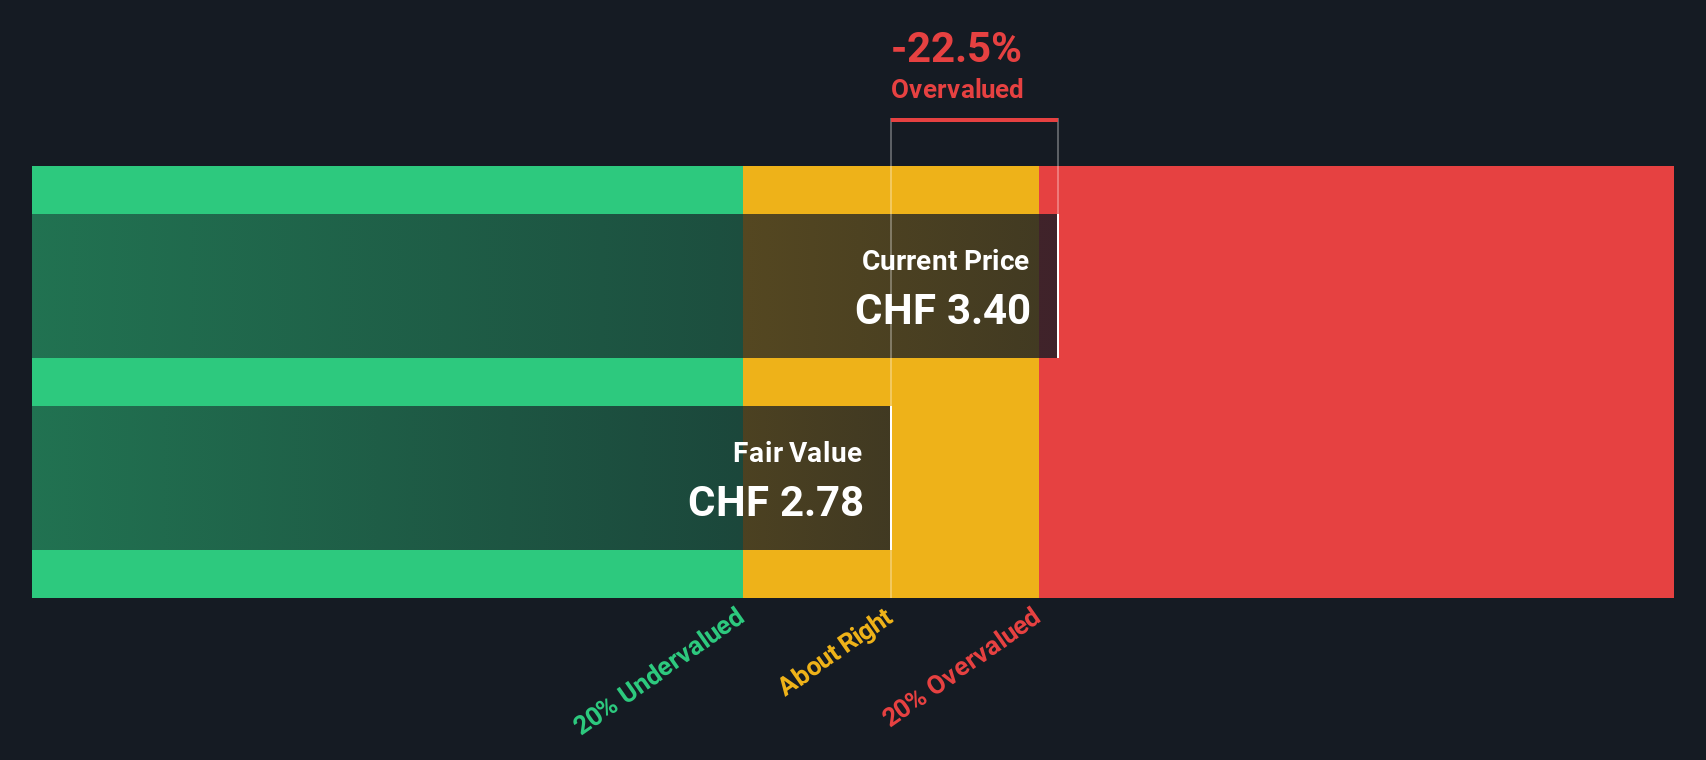
- Using the 2 Stage Free Cash Flow to Equity, OC Oerlikon fair value estimate is CHF2.78
- OC Oerlikon's CHF3.40 share price signals that it might be 22% overvalued
- The CHF3.33 analyst price target for OERL is 20% more than our estimate of fair value
Does the January share price for OC Oerlikon Corporation AG (VTX:OERL) reflect what it's really worth? Today, we will estimate the stock's intrinsic value by taking the expected future cash flows and discounting them to their present value. We will take advantage of the Discounted Cash Flow (DCF) model for this purpose. There's really not all that much to it, even though it might appear quite complex.
Companies can be valued in a lot of ways, so we would point out that a DCF is not perfect for every situation. If you want to learn more about discounted cash flow, the rationale behind this calculation can be read in detail in the Simply Wall St analysis model.
Crunching The Numbers
We are going to use a two-stage DCF model, which, as the name states, takes into account two stages of growth. The first stage is generally a higher growth period which levels off heading towards the terminal value, captured in the second 'steady growth' period. To start off with, we need to estimate the next ten years of cash flows. Where possible we use analyst estimates, but when these aren't available we extrapolate the previous free cash flow (FCF) from the last estimate or reported value. We assume companies with shrinking free cash flow will slow their rate of shrinkage, and that companies with growing free cash flow will see their growth rate slow, over this period. We do this to reflect that growth tends to slow more in the early years than it does in later years.
A DCF is all about the idea that a dollar in the future is less valuable than a dollar today, so we need to discount the sum of these future cash flows to arrive at a present value estimate:
10-year free cash flow (FCF) forecast
| 2026 | 2027 | 2028 | 2029 | 2030 | 2031 | 2032 | 2033 | 2034 | 2035 | |
| Levered FCF (CHF, Millions) | CHF74.8m | CHF75.3m | CHF75.7m | CHF76.2m | CHF76.6m | CHF77.0m | CHF77.3m | CHF77.7m | CHF78.1m | CHF78.5m |
| Growth Rate Estimate Source | Analyst x1 | Analyst x1 | Est @ 0.58% | Est @ 0.55% | Est @ 0.53% | Est @ 0.52% | Est @ 0.51% | Est @ 0.50% | Est @ 0.50% | Est @ 0.50% |
| Present Value (CHF, Millions) Discounted @ 8.8% | CHF68.7 | CHF63.6 | CHF58.8 | CHF54.3 | CHF50.2 | CHF46.4 | CHF42.9 | CHF39.6 | CHF36.6 | CHF33.8 |
("Est" = FCF growth rate estimated by Simply Wall St)
Present Value of 10-year Cash Flow (PVCF) = CHF495m
We now need to calculate the Terminal Value, which accounts for all the future cash flows after this ten year period. The Gordon Growth formula is used to calculate Terminal Value at a future annual growth rate equal to the 5-year average of the 10-year government bond yield of 0.5%. We discount the terminal cash flows to today's value at a cost of equity of 8.8%.
Terminal Value (TV)= FCF2035 × (1 + g) ÷ (r – g) = CHF79m× (1 + 0.5%) ÷ (8.8%– 0.5%) = CHF949m
Present Value of Terminal Value (PVTV)= TV / (1 + r)10= CHF949m÷ ( 1 + 8.8%)10= CHF408m
The total value, or equity value, is then the sum of the present value of the future cash flows, which in this case is CHF903m. In the final step we divide the equity value by the number of shares outstanding. Relative to the current share price of CHF3.4, the company appears slightly overvalued at the time of writing. Valuations are imprecise instruments though, rather like a telescope - move a few degrees and end up in a different galaxy. Do keep this in mind.
The Assumptions
The calculation above is very dependent on two assumptions. The first is the discount rate and the other is the cash flows. If you don't agree with these result, have a go at the calculation yourself and play with the assumptions. The DCF also does not consider the possible cyclicality of an industry, or a company's future capital requirements, so it does not give a full picture of a company's potential performance. Given that we are looking at OC Oerlikon as potential shareholders, the cost of equity is used as the discount rate, rather than the cost of capital (or weighted average cost of capital, WACC) which accounts for debt. In this calculation we've used 8.8%, which is based on a levered beta of 1.974. Beta is a measure of a stock's volatility, compared to the market as a whole. We get our beta from the industry average beta of globally comparable companies, with an imposed limit between 0.8 and 2.0, which is a reasonable range for a stable business.
Check out our latest analysis for OC Oerlikon
SWOT Analysis for OC Oerlikon
- Dividend is in the top 25% of dividend payers in the market.
- Interest payments on debt are not well covered.
- Expensive based on P/S ratio and estimated fair value.
- Annual earnings are forecast to grow faster than the Swiss market.
- Debt is not well covered by operating cash flow.
- Dividends are not covered by earnings and cashflows.
- Annual revenue is expected to decline over the next 4 years.
Looking Ahead:
Valuation is only one side of the coin in terms of building your investment thesis, and it is only one of many factors that you need to assess for a company. It's not possible to obtain a foolproof valuation with a DCF model. Rather it should be seen as a guide to "what assumptions need to be true for this stock to be under/overvalued?" For instance, if the terminal value growth rate is adjusted slightly, it can dramatically alter the overall result. Can we work out why the company is trading at a premium to intrinsic value? For OC Oerlikon, we've compiled three important elements you should explore:
- Risks: You should be aware of the 2 warning signs for OC Oerlikon we've uncovered before considering an investment in the company.
- Future Earnings: How does OERL's growth rate compare to its peers and the wider market? Dig deeper into the analyst consensus number for the upcoming years by interacting with our free analyst growth expectation chart.
- Other Solid Businesses: Low debt, high returns on equity and good past performance are fundamental to a strong business. Why not explore our interactive list of stocks with solid business fundamentals to see if there are other companies you may not have considered!
PS. Simply Wall St updates its DCF calculation for every Swiss stock every day, so if you want to find the intrinsic value of any other stock just search here.
Have feedback on this article? Concerned about the content? Get in touch with us directly. Alternatively, email editorial-team (at) simplywallst.com.
This article by Simply Wall St is general in nature. We provide commentary based on historical data and analyst forecasts only using an unbiased methodology and our articles are not intended to be financial advice. It does not constitute a recommendation to buy or sell any stock, and does not take account of your objectives, or your financial situation. We aim to bring you long-term focused analysis driven by fundamental data. Note that our analysis may not factor in the latest price-sensitive company announcements or qualitative material. Simply Wall St has no position in any stocks mentioned.