
- PREMIUM
- LIVE QUOTES
- INSTITUTIONS
 Index Options
 State Street
 CME Group
 Nasdaq
 Cboe
Cboe TradingView
 Wall Street Journal
Is Ørsted (CPSE:ORSTED) Pricing Fair After A 27.9% One Year Share Price Fall?
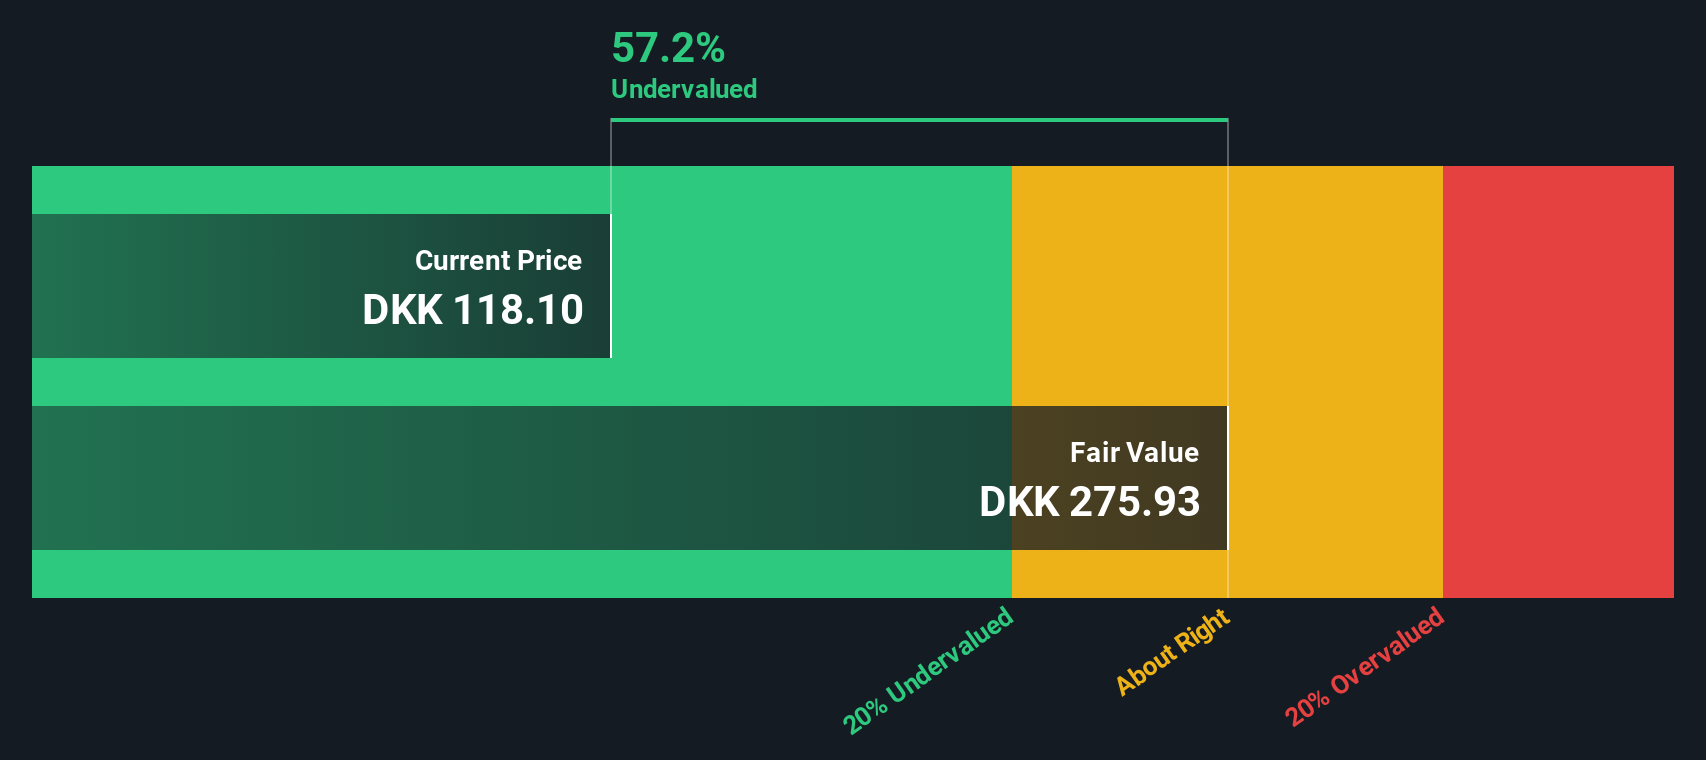
- If you are wondering whether Ørsted’s current share price reflects its true worth, this breakdown will help you see how the market’s view lines up with the underlying numbers.
- The stock last closed at DKK132.45, with returns of 8.3% over the past week, a 3.9% decline over the last 30 days, 3.5% year to date, and a 27.9% decline over the past year, alongside larger drawdowns over 3 and 5 years.
- These moves have played out as investors continue to reassess listed renewables companies and their sensitivity to funding costs and project economics. Ørsted has been part of that broader conversation, with market focus frequently returning to its offshore wind pipeline and capital allocation choices.
- On our checks, Ørsted scores 1 out of 6 on valuation, with only one indicator pointing to the shares being undervalued. You can see the detailed breakdown in its valuation score of 1/6. Next, we compare different valuation approaches and then finish with a way to tie those numbers back to the bigger picture of what the market may be pricing in.
Ørsted scores just 1/6 on our valuation checks. See what other red flags we found in the full valuation breakdown.
Approach 1: Ørsted Dividend Discount Model (DDM) Analysis
The Dividend Discount Model estimates what a share could be worth by projecting future dividends, then discounting them back to today’s value. It is most useful when you care about the income stream, not just the share price moves.
For Ørsted, the model uses a current dividend per share of DKK4.05 and assumes long term dividend growth of 1.71%, capped from an initial 2.30% estimate. That growth rate comes from an expected growth figure of 2.30%, adjusted down to keep assumptions conservative. The model also factors in a very high calculated payout ratio of 9.85 and a return on equity figure of 2.55, which together raise questions about how easily those dividends could be sustained if conditions change.
On these inputs, the DDM output points to an intrinsic value of DKK82.20 per share, compared with the recent market price of DKK132.45. That implies the shares are 61.1% overvalued according to this specific dividend based lens.
Result: OVERVALUED
Our Dividend Discount Model (DDM) analysis suggests Ørsted may be overvalued by 61.1%. Discover 877 undervalued stocks or create your own screener to find better value opportunities.
Approach 2: Ørsted Price vs Sales
For companies where earnings can be volatile or negative, the P/S ratio is often a cleaner way to think about value, because it compares the share price to underlying revenue rather than profit. Investors usually accept a higher or lower P/S depending on what they expect for future growth and how risky they think the business is, so there is no single “right” number.
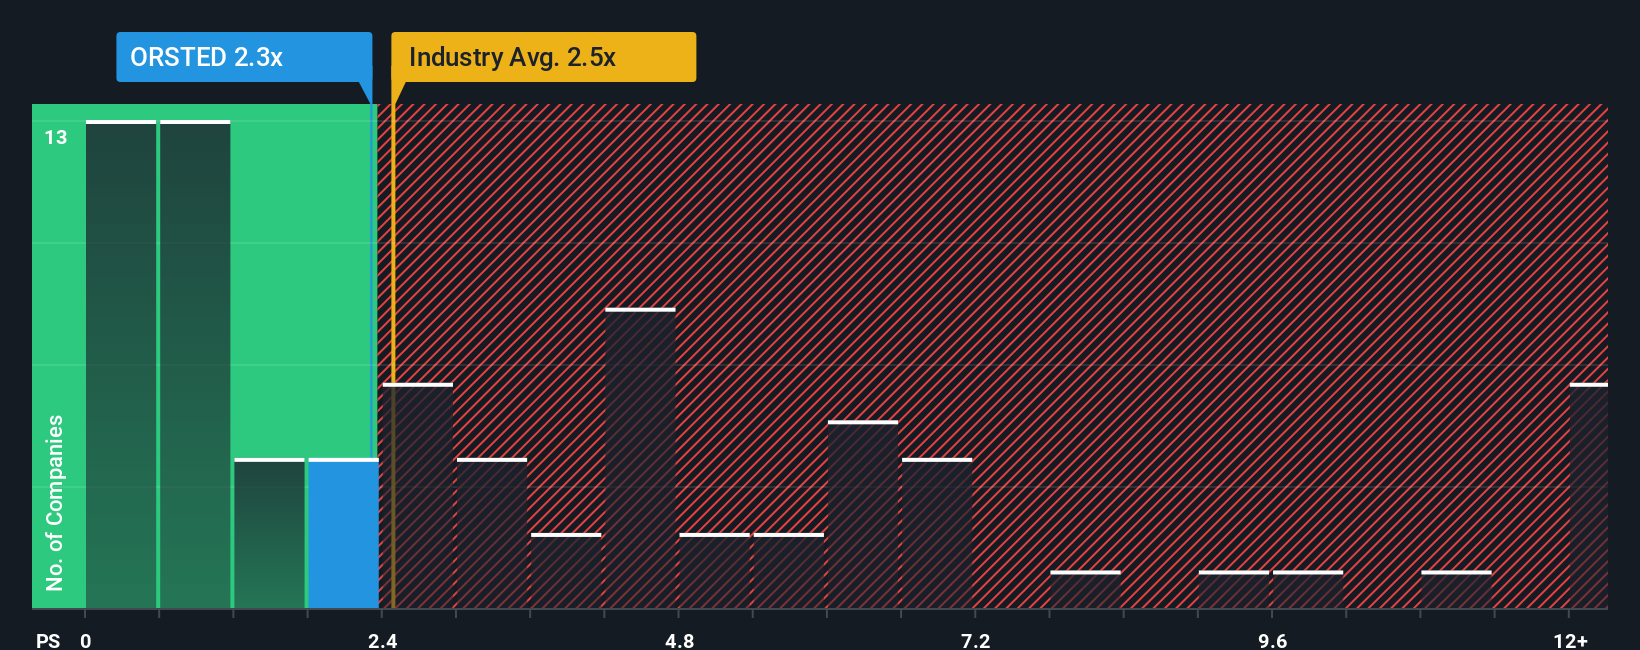
Ørsted currently trades on a P/S of 2.46x. That sits close to the Renewable Energy industry average of about 2.36x, and below the peer group average of 5.27x. Simply Wall St also uses a proprietary “Fair Ratio” for P/S, which estimates the multiple that might fit a company given factors like its growth profile, risks, profit margins, industry and size, rather than just lining it up next to a few peers.
This Fair Ratio approach can give a more tailored view than simple industry or peer comparisons, because two companies can have similar P/S ratios but very different growth outlooks, risk levels or profitability. In Ørsted’s case, the Fair Ratio is not available, so on this metric we can only say the current P/S looks broadly in line with the wider sector.
Result: ABOUT RIGHT
P/S ratios tell one story, but what if the real opportunity lies elsewhere? Discover 1449 companies where insiders are betting big on explosive growth.
Upgrade Your Decision Making: Choose your Ørsted Narrative
Earlier we mentioned that there is an even better way to understand valuation, so let us introduce you to Narratives, where you attach a clear story about Ørsted to your own estimates for its future revenue, earnings, margins and fair value.
A Narrative is simply your view of what the company is doing, why it matters, and how that might flow through to the numbers, then into a fair value that you can compare with today’s share price to decide whether you see Ørsted as attractive, fully priced or expensive.
On Simply Wall St’s Community page, millions of investors can build these Narratives quickly. The platform keeps them updated when new information such as news, project updates or earnings is released, so your story and valuation stay current without you having to rebuild everything from scratch.
For example, one Ørsted Narrative might assume relatively cautious revenue growth and tighter profit margins that support a lower fair value than today’s price. Another could assume stronger long term revenue growth and healthier margins that support a higher fair value, which shows how two investors can look at the same company and reach different conclusions.
Do you think there's more to the story for Ørsted? Head over to our Community to see what others are saying!

This article by Simply Wall St is general in nature. We provide commentary based on historical data and analyst forecasts only using an unbiased methodology and our articles are not intended to be financial advice. It does not constitute a recommendation to buy or sell any stock, and does not take account of your objectives, or your financial situation. We aim to bring you long-term focused analysis driven by fundamental data. Note that our analysis may not factor in the latest price-sensitive company announcements or qualitative material. Simply Wall St has no position in any stocks mentioned.
Have feedback on this article? Concerned about the content? Get in touch with us directly. Alternatively, email editorial-team@simplywallst.com