
- PREMIUM
- LIVE QUOTES
- INSTITUTIONS
 Index Options
 State Street
 CME Group
 Nasdaq
 Cboe
Cboe TradingView
 Wall Street Journal
Is It Too Late To Consider S&P Global (SPGI) After Hitting Recent Share Price Highs
- If you are wondering whether S&P Global's share price still offers value at current levels, you are not alone. Many investors are asking the same question as the stock trades at recent highs.
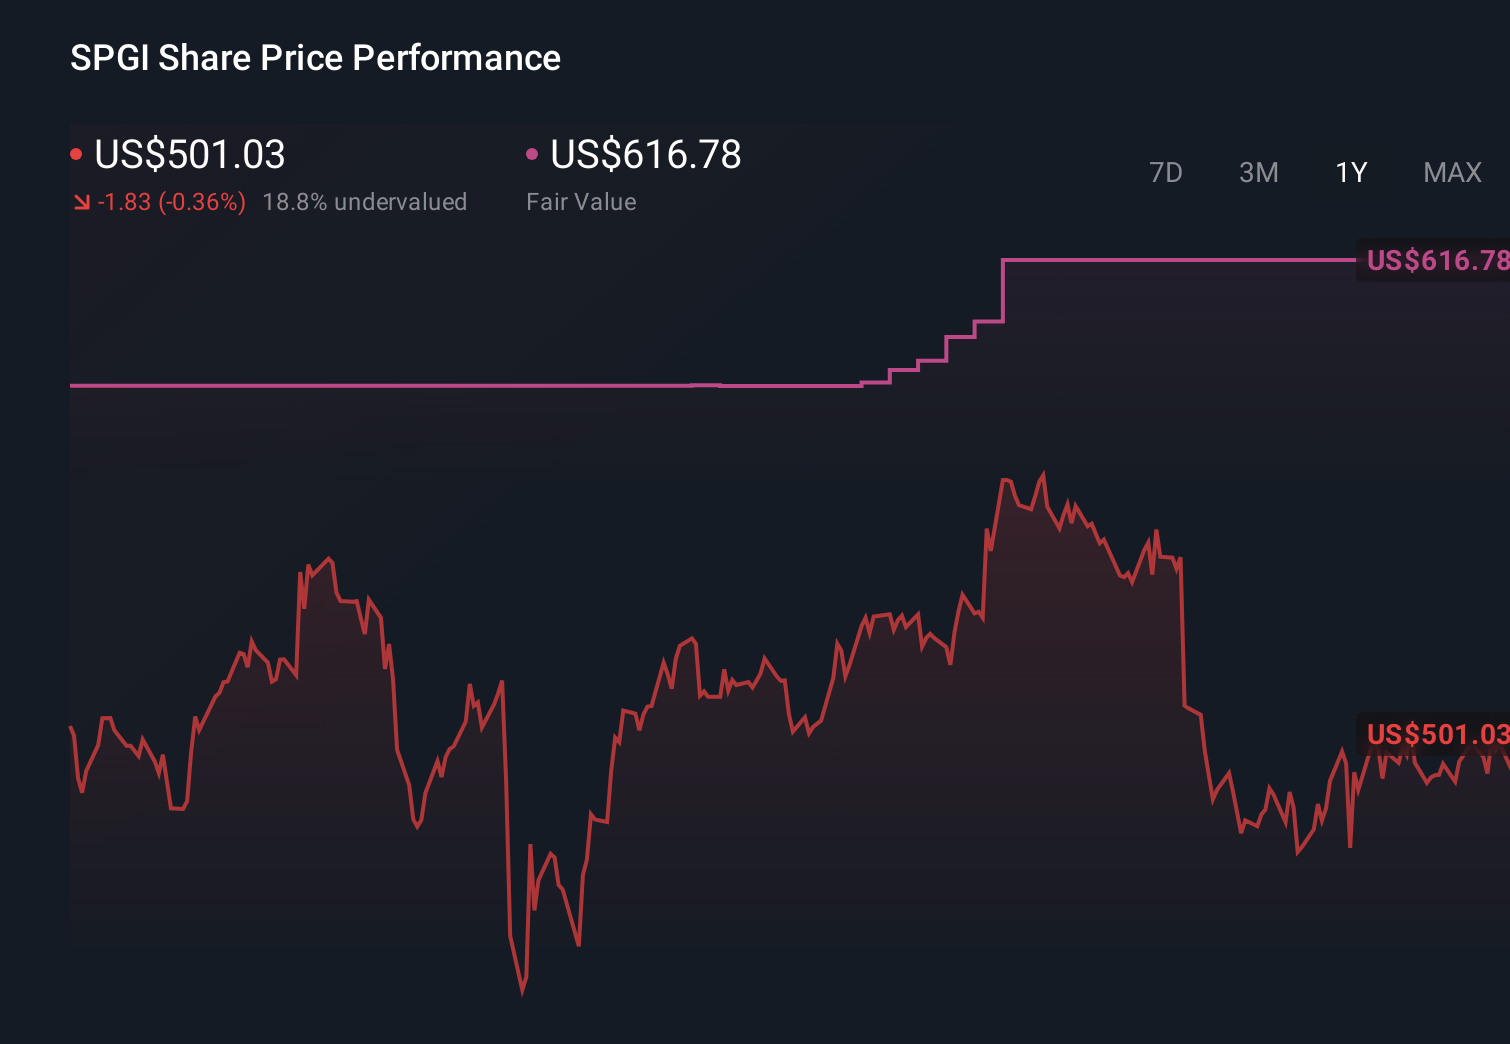
- The stock last closed at US$539.65, with reported returns of 2.3% over 7 days, 8.3% over 30 days, 5.3% year to date, 10.6% over 1 year, 56.1% over 3 years, and 78.1% over 5 years.
- Recent coverage has focused on S&P Global's role in financial data, benchmarks, and credit ratings. Investors are paying close attention to how these businesses position the company within global markets. This backdrop helps frame why the share price moves may matter for anyone thinking about what they are paying for each US$ of earnings and cash flow.
- S&P Global currently has a valuation score of 0/6. Next we will look at how different valuation methods assess the stock and then finish with a simple way to pull those signals together into a clearer view of value.
S&P Global scores just 0/6 on our valuation checks. See what other red flags we found in the full valuation breakdown.
Approach 1: S&P Global Excess Returns Analysis
The Excess Returns model looks at how much profit a company is expected to generate above its cost of equity, then converts those extra profits into an estimated per share value today.
For S&P Global, the model uses a Book Value of US$109.21 per share and a Stable EPS of US$20.55 per share, based on weighted future Return on Equity estimates from 4 analysts. The Average Return on Equity used is 18.02%, compared with a Cost of Equity of US$9.43 per share, which implies an Excess Return of US$11.13 per share. The Stable Book Value input is US$114.06 per share, sourced from weighted future Book Value estimates from 5 analysts.
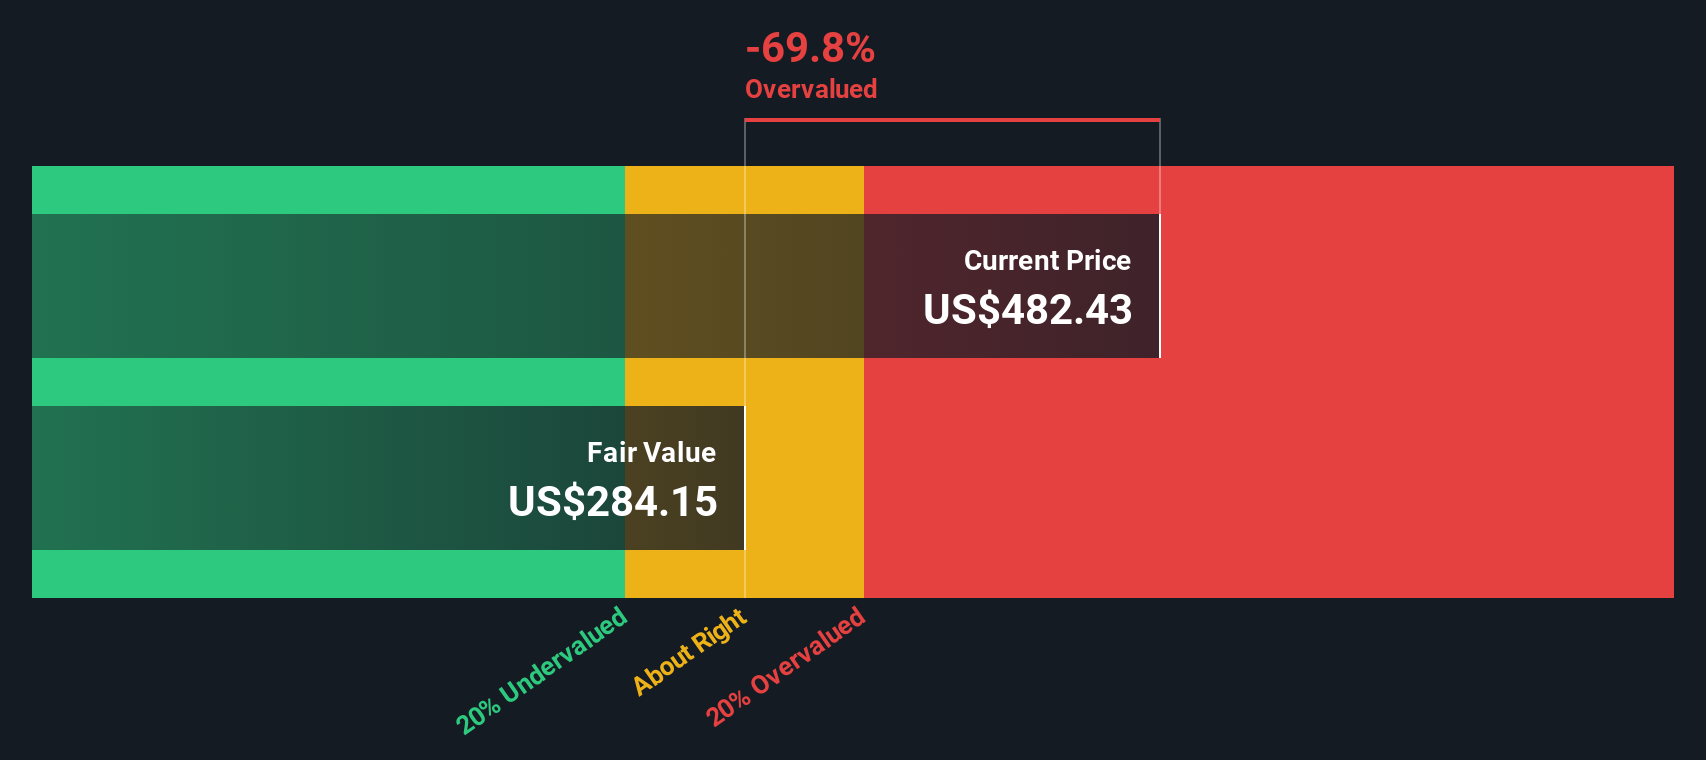
Putting these inputs together, the Excess Returns model arrives at an estimated intrinsic value of about US$336.44 per share. Compared with the recent share price of US$539.65, this indicates the stock is around 60.4% overvalued according to this framework.
Result: OVERVALUED
Our Excess Returns analysis suggests S&P Global may be overvalued by 60.4%. Discover 877 undervalued stocks or create your own screener to find better value opportunities.
Approach 2: S&P Global Price vs Earnings
For a profitable company like S&P Global, the P/E ratio is a useful shorthand for what investors are currently willing to pay for each dollar of earnings. It quickly links the share price to the underlying profit the business is generating.
What counts as a “normal” or “fair” P/E usually reflects two main things: growth expectations and risk. Higher expected earnings growth and lower perceived risk can support a higher multiple, while slower growth or higher risk tends to pull it down.
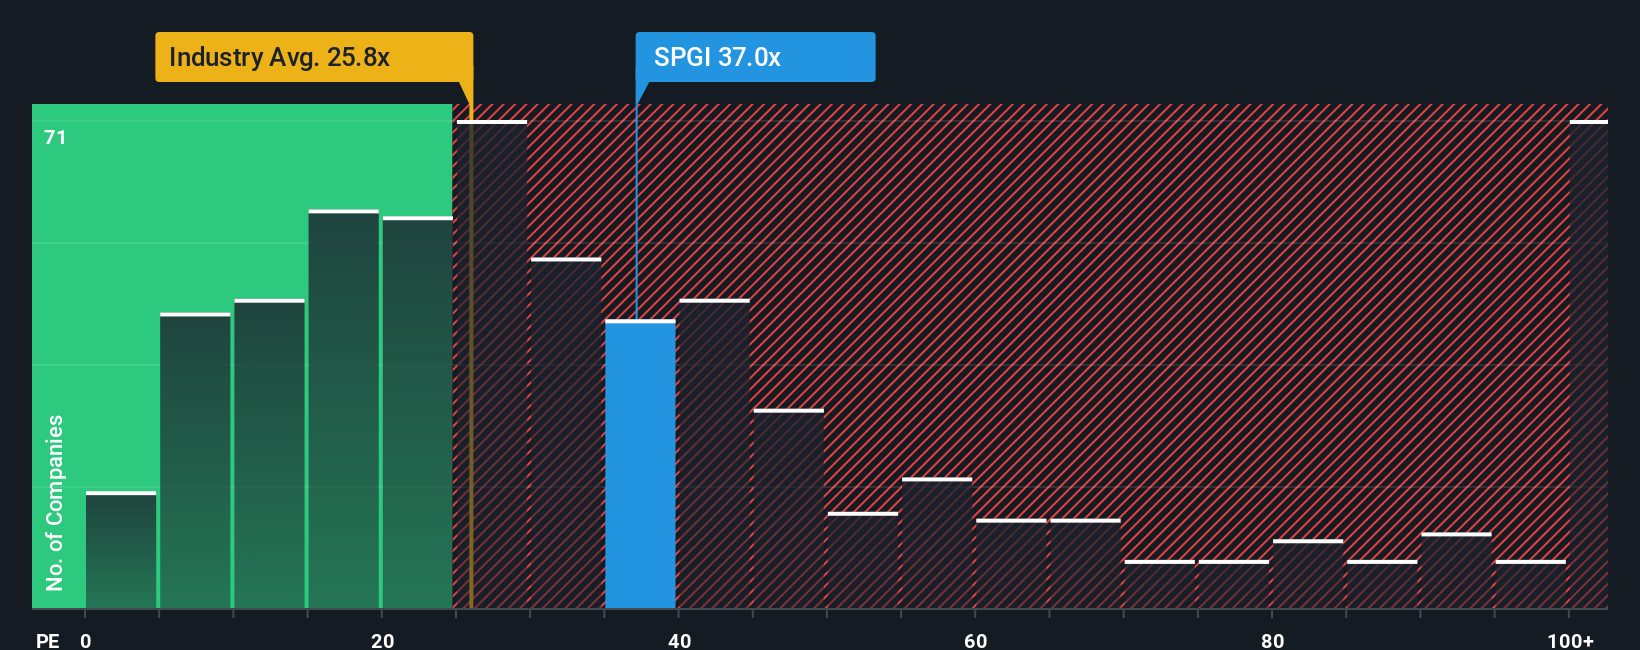
S&P Global is trading on a P/E of 38.75x. That sits above both the Capital Markets industry average P/E of 25.75x and a peer group average of 33.45x. Simply Wall St’s Fair Ratio for S&P Global is 18.50x, which is its proprietary view of what a more typical P/E might be given factors such as the company’s earnings growth profile, margins, size and risk characteristics.
This Fair Ratio is designed to be more tailored than a simple comparison with peers or the broad industry, because it adjusts for company specific traits rather than assuming one multiple fits all. Against this Fair Ratio, the current 38.75x P/E suggests the shares are pricing in a much richer level of expectations.
Result: OVERVALUED
P/E ratios tell one story, but what if the real opportunity lies elsewhere? Discover 1449 companies where insiders are betting big on explosive growth.
Upgrade Your Decision Making: Choose your S&P Global Narrative
Earlier we mentioned that there is an even better way to understand valuation, so let us introduce you to Narratives, which are simply your story about a company linked directly to numbers like fair value, future revenue, earnings and margins.
On Simply Wall St’s Community page, millions of investors use Narratives to connect what they believe about a business to a financial forecast, then to a fair value that they can compare with the current share price.
Because each Narrative updates when new information such as news or earnings is added to the platform, your view of S&P Global’s value can move with the latest data rather than staying fixed to a single static model.
For S&P Global, one Narrative might see a relatively low fair value estimate and cautious revenue and margin assumptions, while another could use more optimistic forecasts that support a significantly higher fair value. This shows how different perspectives can coexist around the same stock.
Do you think there's more to the story for S&P Global? Head over to our Community to see what others are saying!
This article by Simply Wall St is general in nature. We provide commentary based on historical data and analyst forecasts only using an unbiased methodology and our articles are not intended to be financial advice. It does not constitute a recommendation to buy or sell any stock, and does not take account of your objectives, or your financial situation. We aim to bring you long-term focused analysis driven by fundamental data. Note that our analysis may not factor in the latest price-sensitive company announcements or qualitative material. Simply Wall St has no position in any stocks mentioned.
Have feedback on this article? Concerned about the content? Get in touch with us directly. Alternatively, email editorial-team@simplywallst.com