
- PREMIUM
- LIVE QUOTES
- INSTITUTIONS
 Index Options
 State Street
 CME Group
 Nasdaq
 Cboe
Cboe TradingView
 Wall Street Journal
Is Loblaw Companies (TSX:L) Pricing In Too Much Optimism After Strong Multi‑Year Gains
- If you have been watching Loblaw Companies and wondering whether the current share price offers good value, this article will walk through what the numbers are really saying about the stock.
- The share price recently closed at C$60.91, with returns of a 1.8% decline over 7 days, a 2.0% decline over 30 days and a 1.9% decline year to date, set against a 30.6% gain over 1 year and a 112.2% gain over 3 years, while the 5 year return is very large.
- Recent coverage has kept attention on Loblaw as investors weigh its role in Canada's consumer sector and ongoing discussions around food pricing and competition. This helps frame how the market thinks about its risk and resilience, and provides useful context when you look at how its current share price compares with different measures of underlying value.
- Despite that share price history, Loblaw currently scores 0 out of 6 on our valuation checks. This raises fair questions about how it is being priced and whether traditional methods such as P/E, P/B and discounted cash flow tell the full story, or if there is a better way to think about value that we will come to at the end.
Loblaw Companies scores just 0/6 on our valuation checks. See what other red flags we found in the full valuation breakdown.
Approach 1: Loblaw Companies Discounted Cash Flow (DCF) Analysis
A Discounted Cash Flow, or DCF, model takes expected future cash flows and discounts them back to today using a required rate of return to estimate what the entire business might be worth in CA$ right now.
For Loblaw Companies, the model uses last twelve month free cash flow of about CA$3.49b as a starting point. Analysts provide explicit free cash flow estimates out to 2027, including CA$2.63b in 2027, and Simply Wall St then extrapolates these further using its 2 Stage Free Cash Flow to Equity approach. The ten year path includes projected free cash flows such as CA$2.44b in 2026 and CA$2.25b in 2035, expressed in today’s money through discounting.
When all those discounted cash flows are added together, the model estimates an intrinsic value of about CA$42.26 per share. Compared with the recent share price of CA$60.91, this implies the stock is 44.1% overvalued on this DCF view.
Result: OVERVALUED
Our Discounted Cash Flow (DCF) analysis suggests Loblaw Companies may be overvalued by 44.1%. Discover 877 undervalued stocks or create your own screener to find better value opportunities.

Approach 2: Loblaw Companies Price vs Earnings
For a profitable business like Loblaw Companies, the P/E ratio is a useful way to think about what you are paying for each dollar of earnings. Investors usually accept a higher P/E when they expect stronger earnings growth or lower risk, and a lower P/E when growth expectations are weaker or perceived risk is higher.
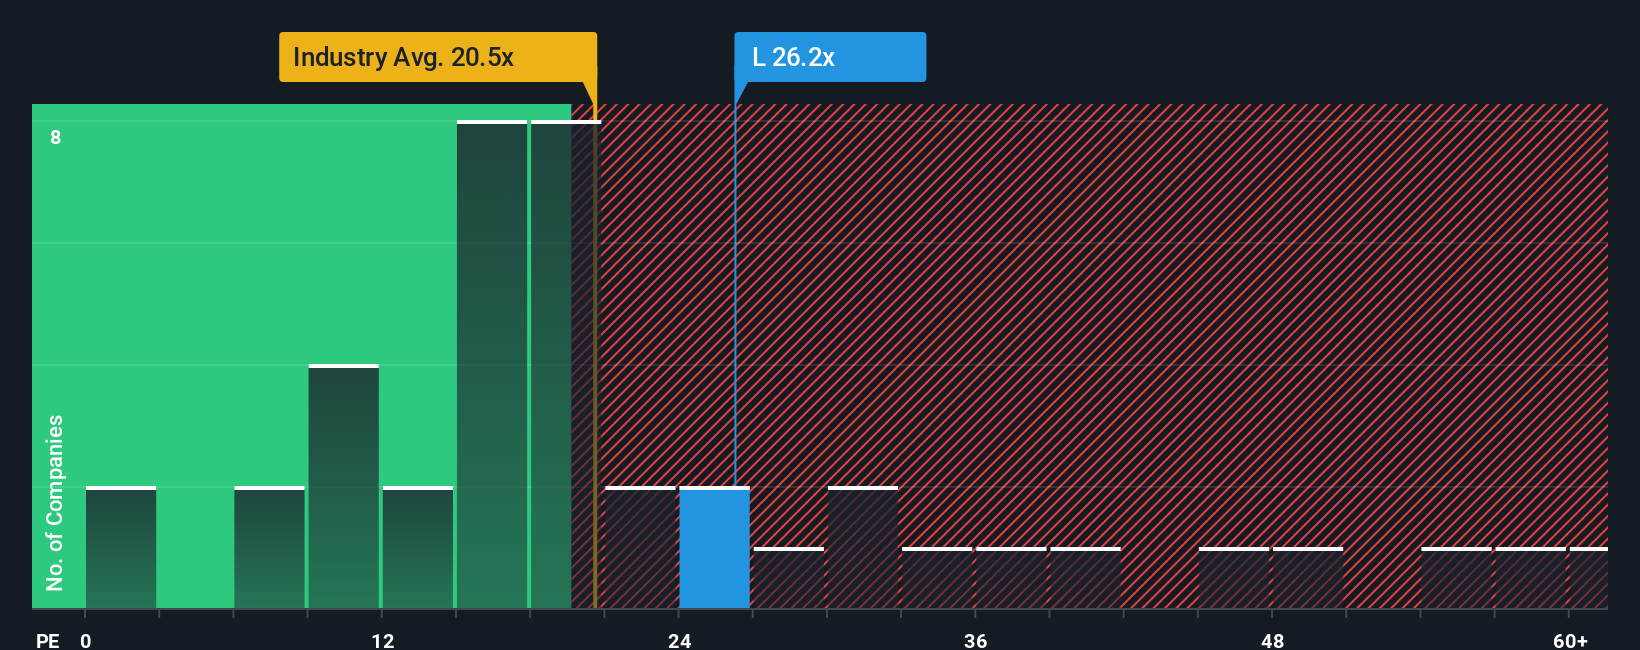
Loblaw currently trades on a P/E of 28.95x. That sits above the Consumer Retailing industry average P/E of 17.75x and also above the peer group average of 19.89x. Simply Wall St’s Fair Ratio framework estimates what a more “normal” P/E might look like for Loblaw at 24.60x, based on factors such as its earnings profile, industry, profit margins, market value and specific risks.
This Fair Ratio is designed to be more tailored than a simple comparison with peers or the broad industry because it adjusts for company specific characteristics rather than treating all retailers as if they are the same. Set against that Fair Ratio, Loblaw’s current P/E of 28.95x is higher, which points to the shares looking expensive on this earnings based view.
Result: OVERVALUED
P/E ratios tell one story, but what if the real opportunity lies elsewhere? Discover 1449 companies where insiders are betting big on explosive growth.
Upgrade Your Decision Making: Choose your Loblaw Companies Narrative
Earlier we mentioned that there is an even better way to understand valuation, so let us introduce you to Narratives. This is a simple tool on Simply Wall St’s Community page where you connect your view of Loblaw’s story to a concrete forecast and a fair value, then compare that fair value to the current share price. The Narrative then updates as new news or earnings arrive. For example, one investor on the platform can look at Loblaw’s healthcare expansion, ESG work, automation and digital loyalty programs and decide on a higher fair value around CA$66.75. Another investor may focus on e-commerce competition, margin pressure, regulation, supply chain risks and heavy investment, and land closer to CA$39.00.
Do you think there's more to the story for Loblaw Companies? Head over to our Community to see what others are saying!

This article by Simply Wall St is general in nature. We provide commentary based on historical data and analyst forecasts only using an unbiased methodology and our articles are not intended to be financial advice. It does not constitute a recommendation to buy or sell any stock, and does not take account of your objectives, or your financial situation. We aim to bring you long-term focused analysis driven by fundamental data. Note that our analysis may not factor in the latest price-sensitive company announcements or qualitative material. Simply Wall St has no position in any stocks mentioned.
Have feedback on this article? Concerned about the content? Get in touch with us directly. Alternatively, email editorial-team@simplywallst.com