
- PREMIUM
- LIVE QUOTES
- INSTITUTIONS
 Index Options
 State Street
 CME Group
 Nasdaq
 Cboe
Cboe TradingView
 Wall Street Journal
Is Roche Holding (SWX:ROG) Still Attractive After Its Strong Multi Year Share Price Run?
- Wondering if Roche Holding is still a sensible entry point after a strong run, or if the easy money has already been made? This article is built to help you think clearly about what you might be paying for today.
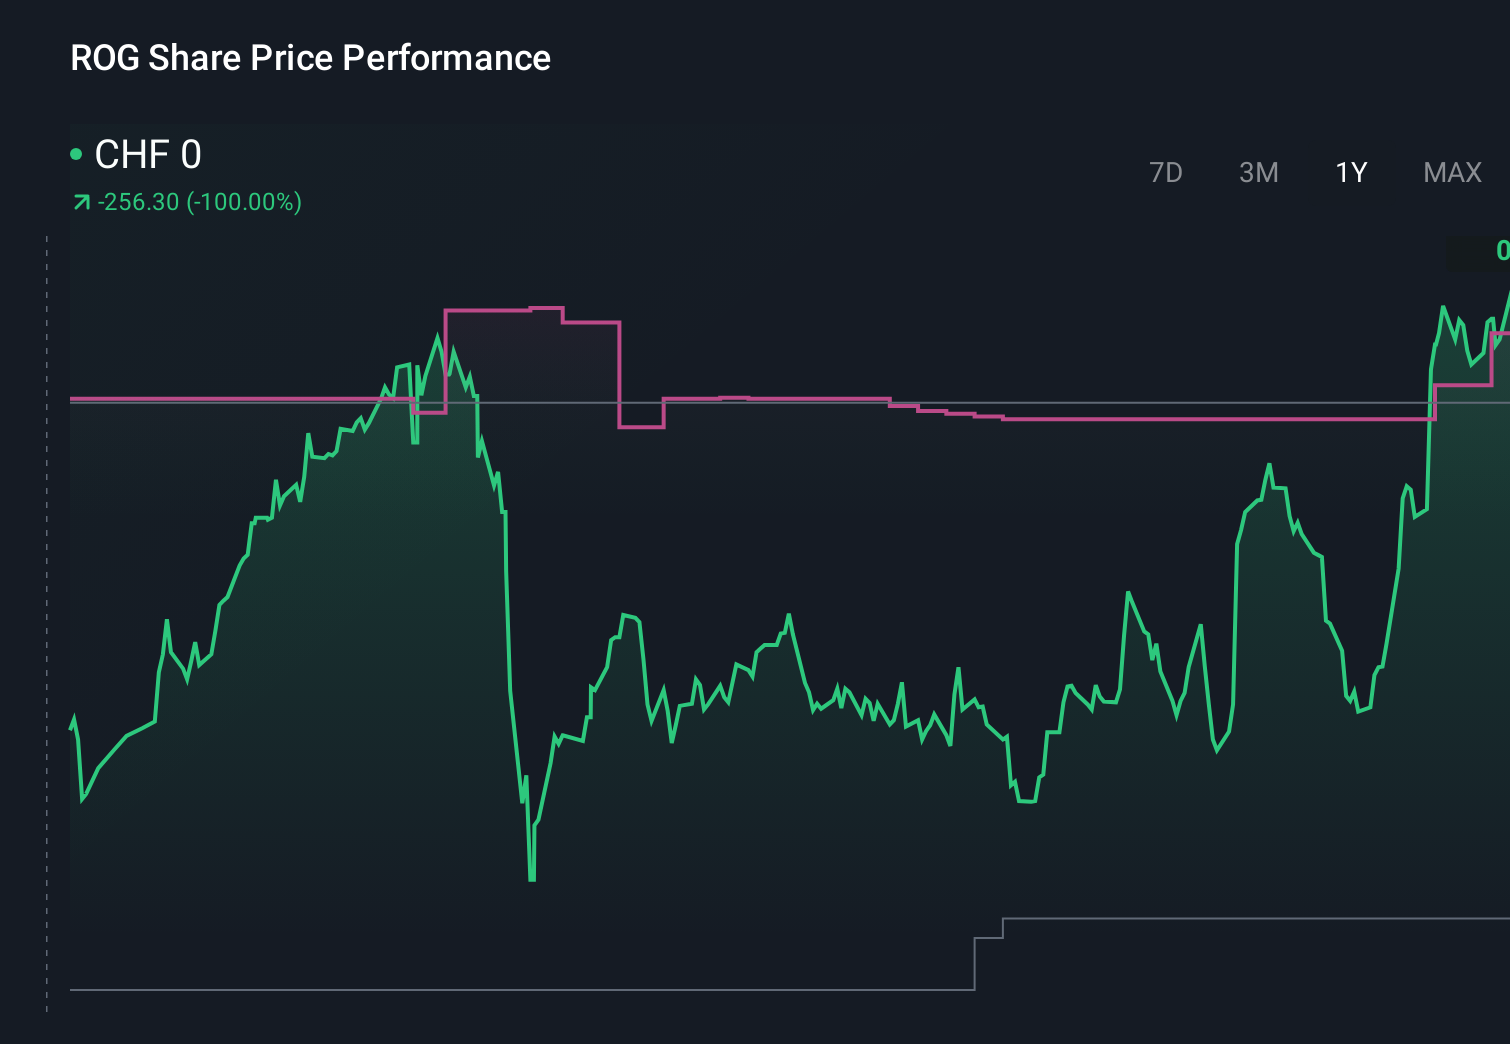
- The stock last closed at CHF 329.90, with returns of 0.5% over 7 days, 6.1% over 30 days, 1.4% year to date, 28.9% over 1 year and 25.8% over 3 years, as well as 23.9% over 5 years. This raises fair questions about how expectations and perceived risk are now priced in.
- Recent news around Roche has focused on its position in global pharmaceuticals, product pipeline updates and ongoing partnerships. All of these help shape how investors think about future cash flows and resilience. These developments provide important context for the share price moves you have seen over the last few months, and set the scene for a closer look at what investors may be willing to pay for that profile.
- Right now, Roche Holding has a valuation score of 4 out of 6, based on checks of whether the shares look undervalued across several metrics. Next we will walk through those methods and how they line up, before finishing with a straightforward way to tie them together into an even clearer view of value.
Find out why Roche Holding's 28.9% return over the last year is lagging behind its peers.
Approach 1: Roche Holding Discounted Cash Flow (DCF) Analysis
A Discounted Cash Flow, or DCF, model takes estimates of the cash a business could generate in the future and discounts them back to today, to arrive at an estimate of what the entire stream of cash flows might be worth now.
For Roche Holding, the model uses a 2 Stage Free Cash Flow to Equity approach, based on cash flow projections in CHF. The latest twelve month free cash flow is about CHF 14.1b. Analysts provide explicit forecasts out to 2030, with Simply Wall St extrapolating beyond that. Within this, the projected free cash flow for 2030 is CHF 20.6b, with intermediate annual projections between 2026 and 2035 discounted back to today.
Putting all of these discounted cash flows together gives an estimated intrinsic value of CHF 732.16 per share, compared with the recent share price of CHF 329.90. On this model, the stock screens as around 54.9% undervalued.
Result: UNDERVALUED
Our Discounted Cash Flow (DCF) analysis suggests Roche Holding is undervalued by 54.9%. Track this in your watchlist or portfolio, or discover 875 more undervalued stocks based on cash flows.

Approach 2: Roche Holding Price vs Earnings
For profitable companies, the P/E ratio is a useful shorthand because it links what you pay for each share directly to the earnings that support that share. It gives you a quick sense of how many years of current earnings the market is willing to pay for today.
What counts as a "normal" P/E ratio depends a lot on how investors see growth potential and risk. Higher expected growth or lower perceived risk can justify a higher multiple, while slower growth or higher risk usually means a lower one.
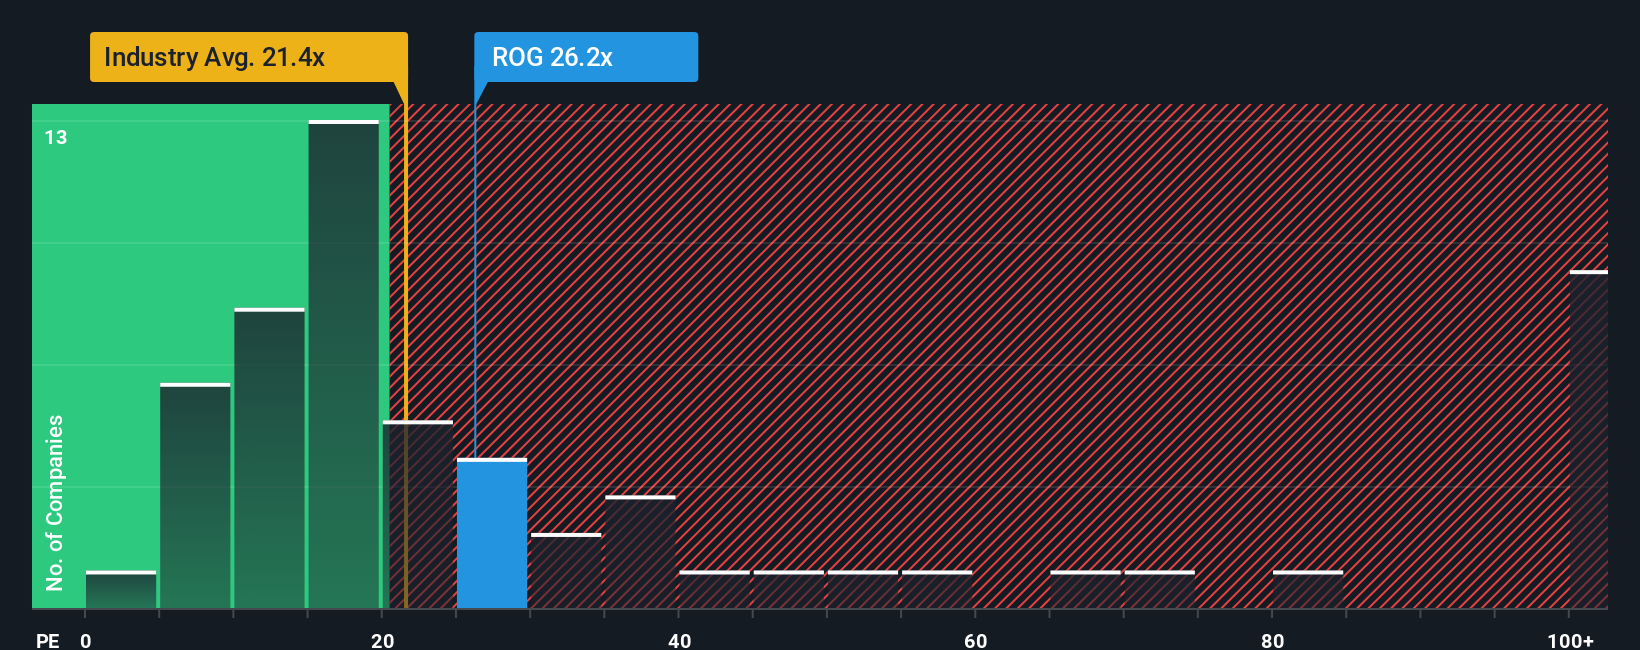
Roche Holding currently trades on a P/E of 29.75x. That sits above the Pharmaceuticals industry average of 22.69x, and below the peer group average of 82.90x, which suggests peers, on average, carry a much richer multiple.
Simply Wall St also calculates a Fair Ratio of 41.65x. This is a proprietary P/E level that reflects factors such as Roche Holding's earnings profile, industry, profit margins, market cap and specific risks. It can be more informative than a simple industry or peer comparison because it tries to match the multiple to the company’s own characteristics rather than broad group averages.
With the Fair Ratio of 41.65x sitting above the current 29.75x, this approach points to Roche Holding appearing undervalued on earnings.
Result: UNDERVALUED
P/E ratios tell one story, but what if the real opportunity lies elsewhere? Discover 1448 companies where insiders are betting big on explosive growth.
Upgrade Your Decision Making: Choose your Roche Holding Narrative
Earlier we mentioned that there is an even better way to think about valuation. Let us introduce Narratives, which let you put a clear story behind the numbers by linking your view of Roche Holding’s future revenue, earnings and margins to a financial forecast and a fair value. All of this is available within an easy tool on Simply Wall St’s Community page that millions of investors use to compare their own fair value to the current share price. You can see that one Roche Narrative currently points to a fair value near CHF 302, while another sits closer to CHF 323, and watch those views update automatically as new earnings, news or pipeline data arrive. This can help you decide for yourself whether today's price around CHF 329.90 feels high, low or about right for the story you believe.
Do you think there's more to the story for Roche Holding? Head over to our Community to see what others are saying!
This article by Simply Wall St is general in nature. We provide commentary based on historical data and analyst forecasts only using an unbiased methodology and our articles are not intended to be financial advice. It does not constitute a recommendation to buy or sell any stock, and does not take account of your objectives, or your financial situation. We aim to bring you long-term focused analysis driven by fundamental data. Note that our analysis may not factor in the latest price-sensitive company announcements or qualitative material. Simply Wall St has no position in any stocks mentioned.
Have feedback on this article? Concerned about the content? Get in touch with us directly. Alternatively, email editorial-team@simplywallst.com