
- PREMIUM
- LIVE QUOTES
- INSTITUTIONS
 Index Options
 State Street
 CME Group
 Nasdaq
 Cboe
Cboe TradingView
 Wall Street Journal
Is Deckers Outdoor (DECK) Pricing Reflect Its Cash Flow And Earnings After 1-Year Share Price Slump
- If you are wondering whether Deckers Outdoor's current share price reflects its true worth, you are not alone. This article is built to focus squarely on what you might be paying for versus what you are getting.
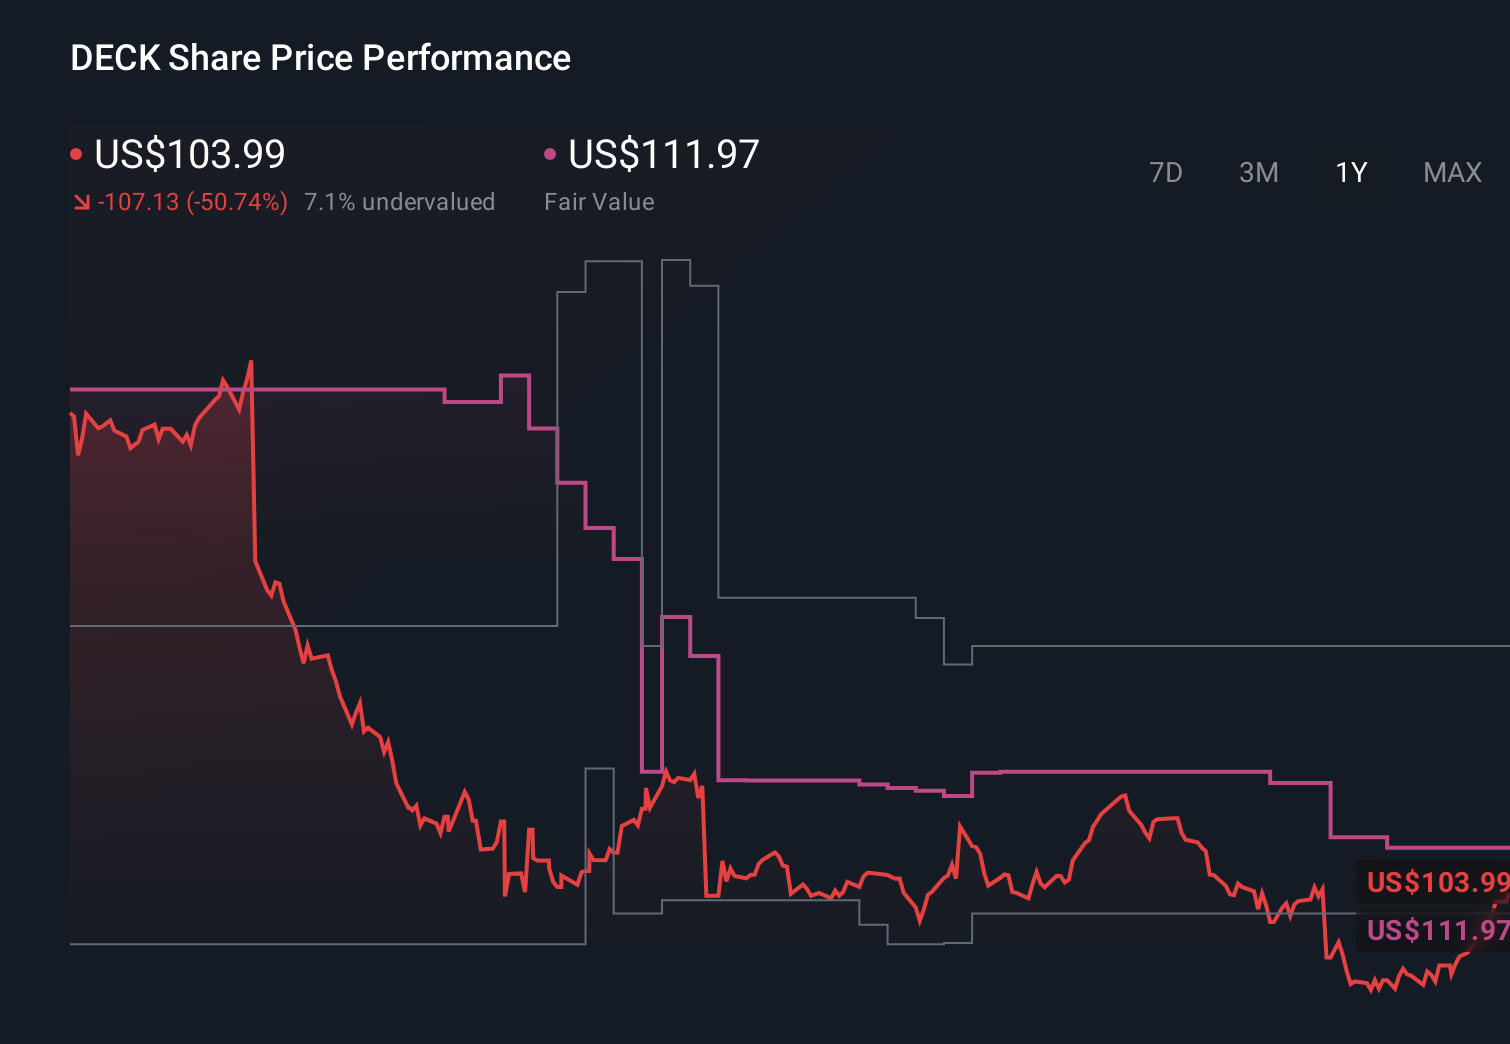
- The stock last closed at US$107.46, with returns of 2.3% over 7 days, 7.8% over 30 days, 0.6% year to date, a 47.6% decline over 1 year, and gains of 58.8% over 3 years and 93.8% over 5 years. Taken together, this gives a mixed picture for investors thinking about risk and opportunity.
- These moves have played out alongside ongoing attention on Deckers Outdoor's position in the consumer durables space and how the market is weighing its brand strength against broader sector sentiment. For long term holders and new investors alike, this context helps explain why the share price can shift even when company specific headlines are relatively quiet.
- On our checks, Deckers Outdoor earns a valuation score of 5/6. Next, we will walk through what different valuation methods say about that number, before finishing with a way to look at value that goes beyond the usual ratios.
Find out why Deckers Outdoor's -47.6% return over the last year is lagging behind its peers.
Approach 1: Deckers Outdoor Discounted Cash Flow (DCF) Analysis
A Discounted Cash Flow, or DCF, model takes a series of projected future cash flows and then discounts them back to what they might be worth to you in today’s dollars. It is essentially asking what those future cash flows are worth right now.
For Deckers Outdoor, the model used is a 2 Stage Free Cash Flow to Equity approach. The latest twelve month free cash flow is reported at about $961 million. Analysts provide explicit forecasts out to 2028, with free cash flow for the year to 31 March 2028 estimated at $1,098.618 million. Beyond that, Simply Wall St extrapolates further annual free cash flow out to 2035, all in dollars and all remaining below $2 billion.
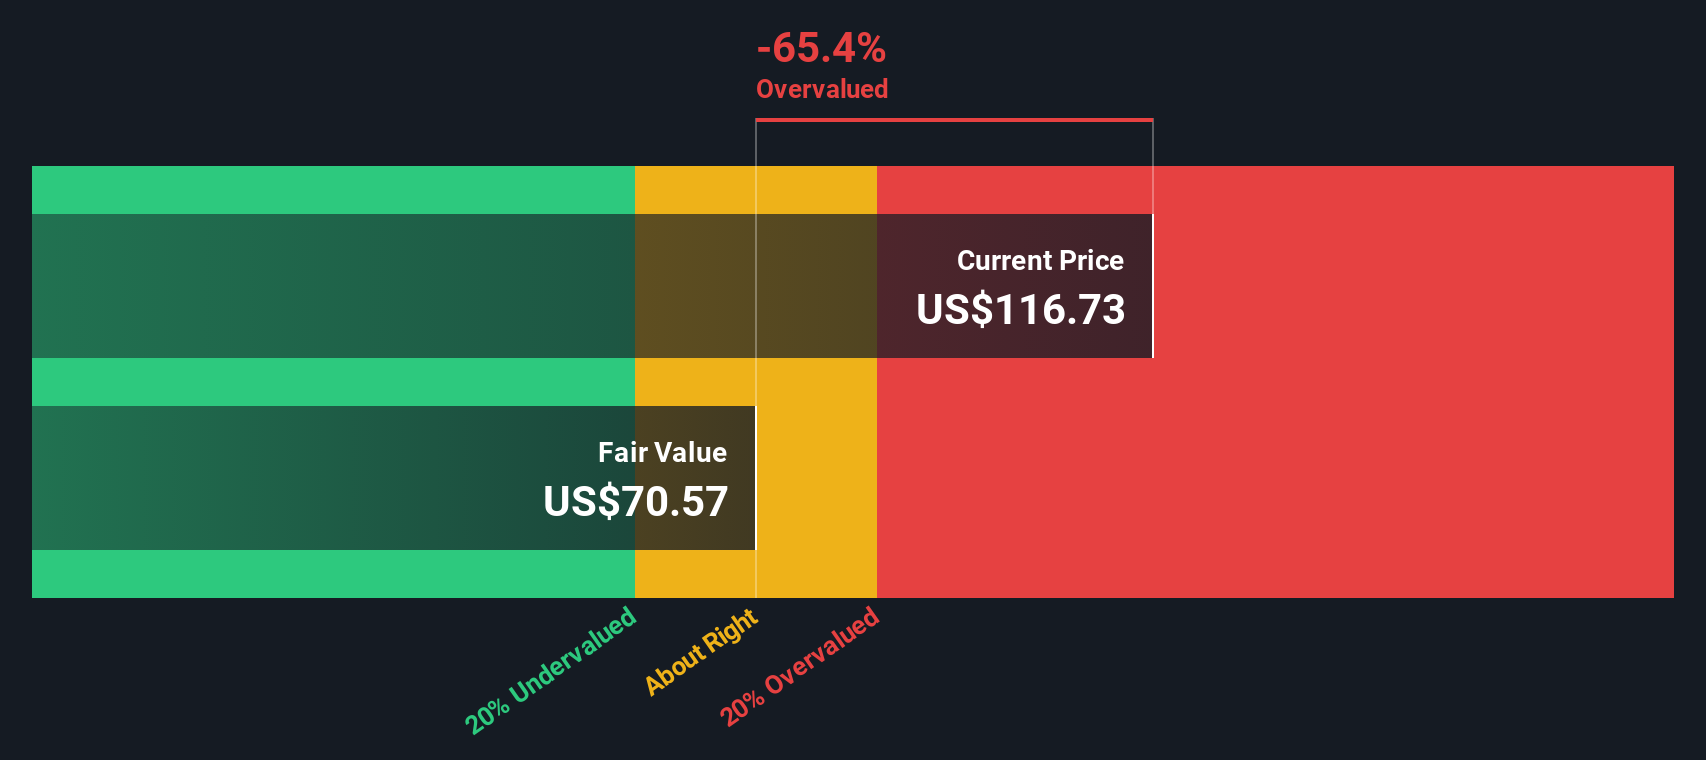
When those projected cash flows are discounted back and summed, the model arrives at an estimated intrinsic value of about $136.31 per share. Compared with the recent share price of $107.46, this implies a 21.2% discount, which indicates that Deckers Outdoor is trading below this DCF estimate.
Result: UNDERVALUED
Our Discounted Cash Flow (DCF) analysis suggests Deckers Outdoor is undervalued by 21.2%. Track this in your watchlist or portfolio, or discover 875 more undervalued stocks based on cash flows.
Approach 2: Deckers Outdoor Price vs Earnings
For profitable companies, the P/E ratio is a straightforward way to link what you pay per share to the earnings the business is currently generating. It lets you see how many dollars of price the market is attaching to each dollar of earnings.
What counts as a "normal" P/E depends on how the market views a company’s growth prospects and risk. Higher expected growth or lower perceived risk can support a higher multiple, while lower growth or higher risk can lead to a lower one.
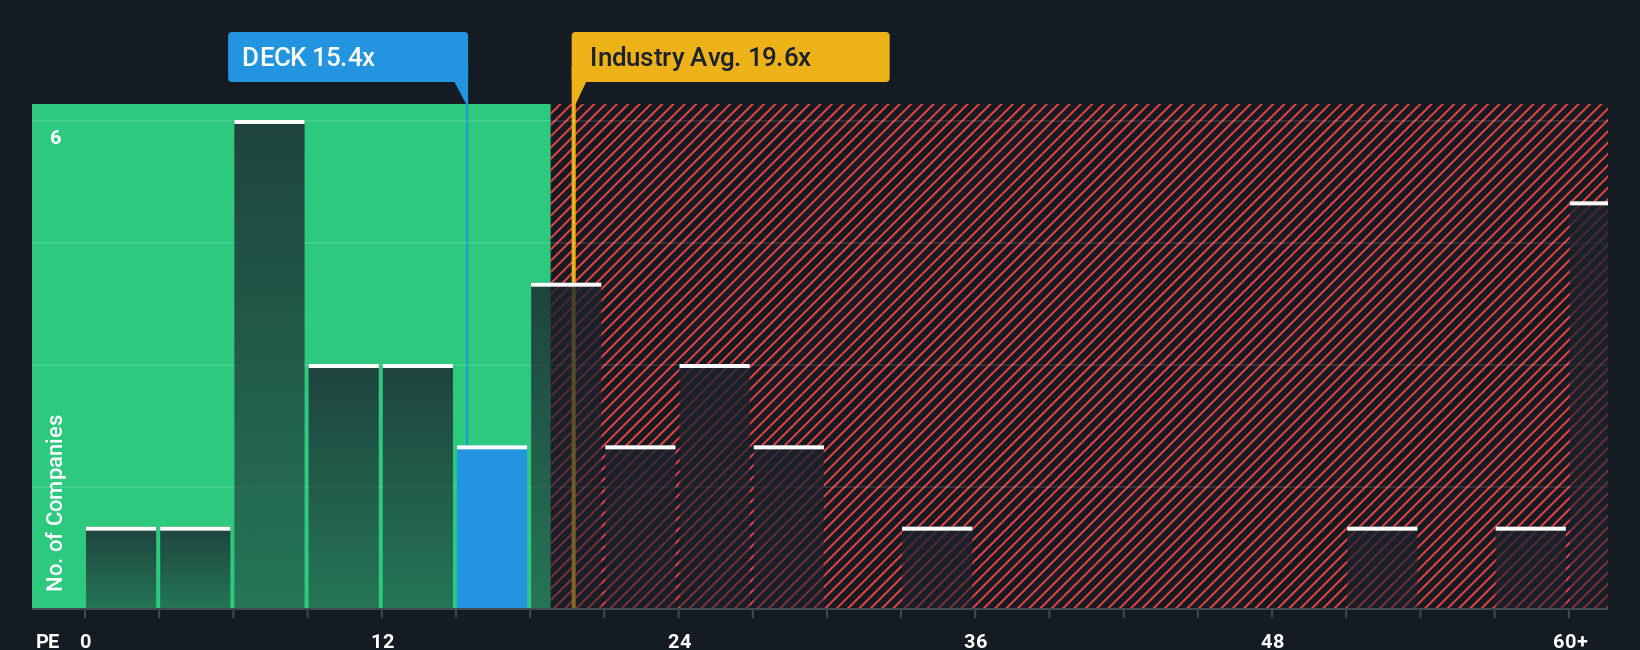
Deckers Outdoor is trading on a P/E of 15.42x. That sits below the Luxury industry average of 19.88x and also below the peer group average of 39.84x, which suggests the market is pricing the stock more conservatively than many peers. Simply Wall St’s Fair Ratio for Deckers Outdoor is 16.68x, which is its proprietary view of what a "reasonable" P/E could be after considering factors like earnings growth, industry, profit margins, market cap and risk.
The Fair Ratio can be more useful than a simple peer or industry comparison because it adjusts for these company specific features rather than treating all Luxury names as equal. With the current P/E at 15.42x versus a Fair Ratio of 16.68x, the shares screen as undervalued on this metric.
Result: UNDERVALUED
P/E ratios tell one story, but what if the real opportunity lies elsewhere? Discover 1448 companies where insiders are betting big on explosive growth.
Upgrade Your Decision Making: Choose your Deckers Outdoor Narrative
Earlier we mentioned that there is an even better way to understand valuation, so let us introduce you to Narratives, a feature on Simply Wall St’s Community page that lets you tie your own story about Deckers Outdoor to explicit assumptions for future revenue, earnings, margins and a fair value. You can then compare that fair value with the current price to decide whether the stock looks attractive or not. The platform keeps updating those Narratives as new news or earnings arrive. For example, one investor might build a bullish Deckers Outdoor Narrative that leans toward the higher analyst price target of US$158 with stronger brand and buyback assumptions. A more cautious investor might anchor closer to the US$97 target. Seeing those different Narratives side by side can help you decide which story, and which fair value, best fits your view.
Do you think there's more to the story for Deckers Outdoor? Head over to our Community to see what others are saying!
This article by Simply Wall St is general in nature. We provide commentary based on historical data and analyst forecasts only using an unbiased methodology and our articles are not intended to be financial advice. It does not constitute a recommendation to buy or sell any stock, and does not take account of your objectives, or your financial situation. We aim to bring you long-term focused analysis driven by fundamental data. Note that our analysis may not factor in the latest price-sensitive company announcements or qualitative material. Simply Wall St has no position in any stocks mentioned.
Have feedback on this article? Concerned about the content? Get in touch with us directly. Alternatively, email editorial-team@simplywallst.com