
- PREMIUM
- LIVE QUOTES
- INSTITUTIONS
 Index Options
 State Street
 CME Group
 Nasdaq
 Cboe
Cboe TradingView
 Wall Street Journal
Is Ford Motor (F) Stock Pricing Reflect Its Recent 52% Return And Conflicting Valuation Signals
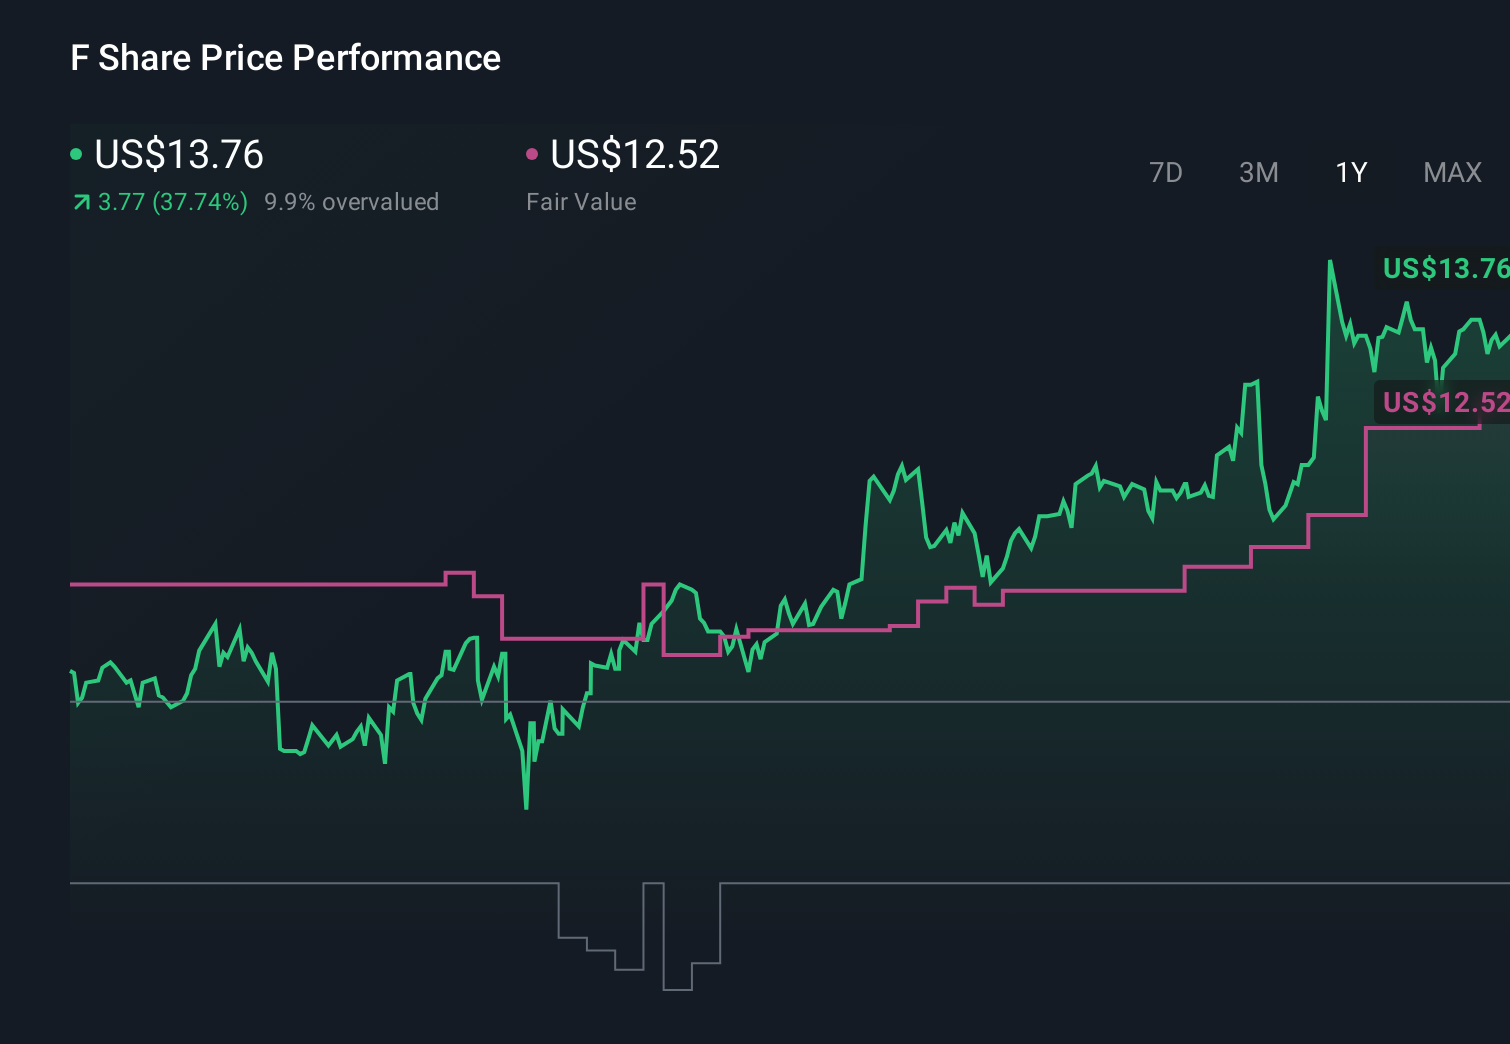
- If you are wondering whether Ford Motor's current share price lines up with its true worth, you are not alone.
- Over the last year, the stock shows a 51.9% return, with 4.3% over 7 days, 5.9% over 30 days and 3.4% year to date, which has naturally changed how some investors think about its risk and potential.
- Recent coverage has focused on Ford Motor's role in the U.S. auto market and investor interest in its longer term transition plans, with headlines often linking the share price to sentiment around the company's position in traditional vehicles and newer technologies. This backdrop helps explain why the stock's recent returns are getting fresh attention from both long time holders and newer investors.
- Right now, Ford Motor scores 3/6 on our valuation checks. In what follows, we look at what different methods say about the stock's value and then finish with a way to tie those numbers together into a clearer picture.
Approach 1: Ford Motor Discounted Cash Flow (DCF) Analysis
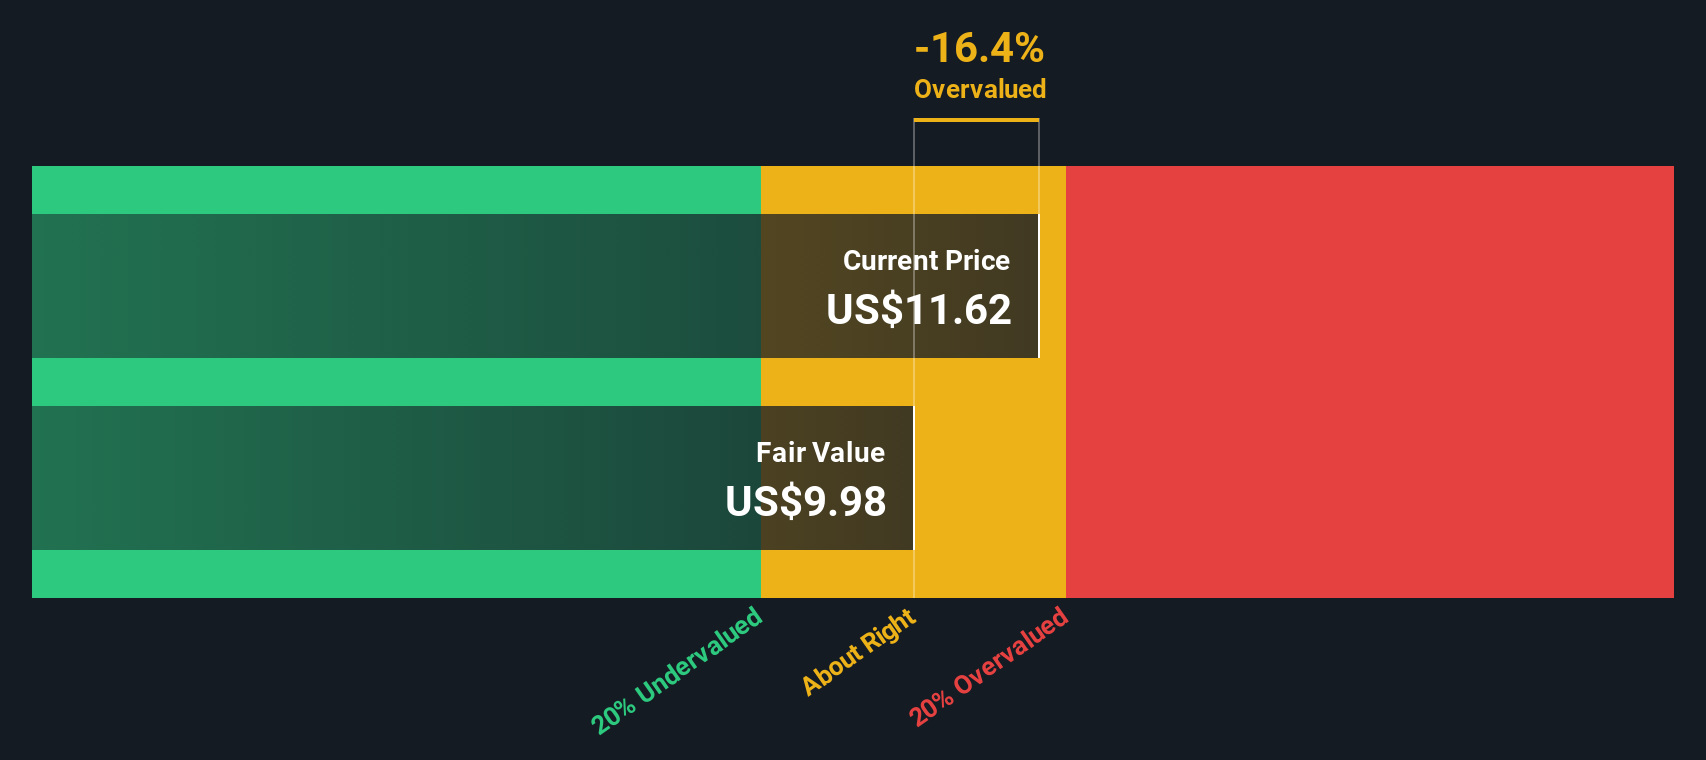
The Discounted Cash Flow, or DCF, model estimates what a business could be worth by projecting its future cash flows and then discounting those back to today using a required rate of return. It is essentially asking what all of Ford Motor's future cash flows in dollars are worth in present terms.
For Ford Motor, the model used is a 2 Stage Free Cash Flow to Equity approach. The latest twelve month free cash flow is about $11.75b. Analysts provide explicit forecasts out to 2027, with free cash flow for that year estimated at $7.16b. Beyond that, Simply Wall St extrapolates cash flows out to 2035, with projected free cash flow in 2035 of $4.75b based on the pattern of earlier estimates.
Bringing all of those projected cash flows in dollars back to today gives an estimated intrinsic value of $11.69 per share. Compared with the current share price, the DCF output implies the stock is around 18.0% overvalued on this model.
Result: OVERVALUED
Our Discounted Cash Flow (DCF) analysis suggests Ford Motor may be overvalued by 18.0%. Discover 875 undervalued stocks or create your own screener to find better value opportunities.
Approach 2: Ford Motor Price vs Earnings
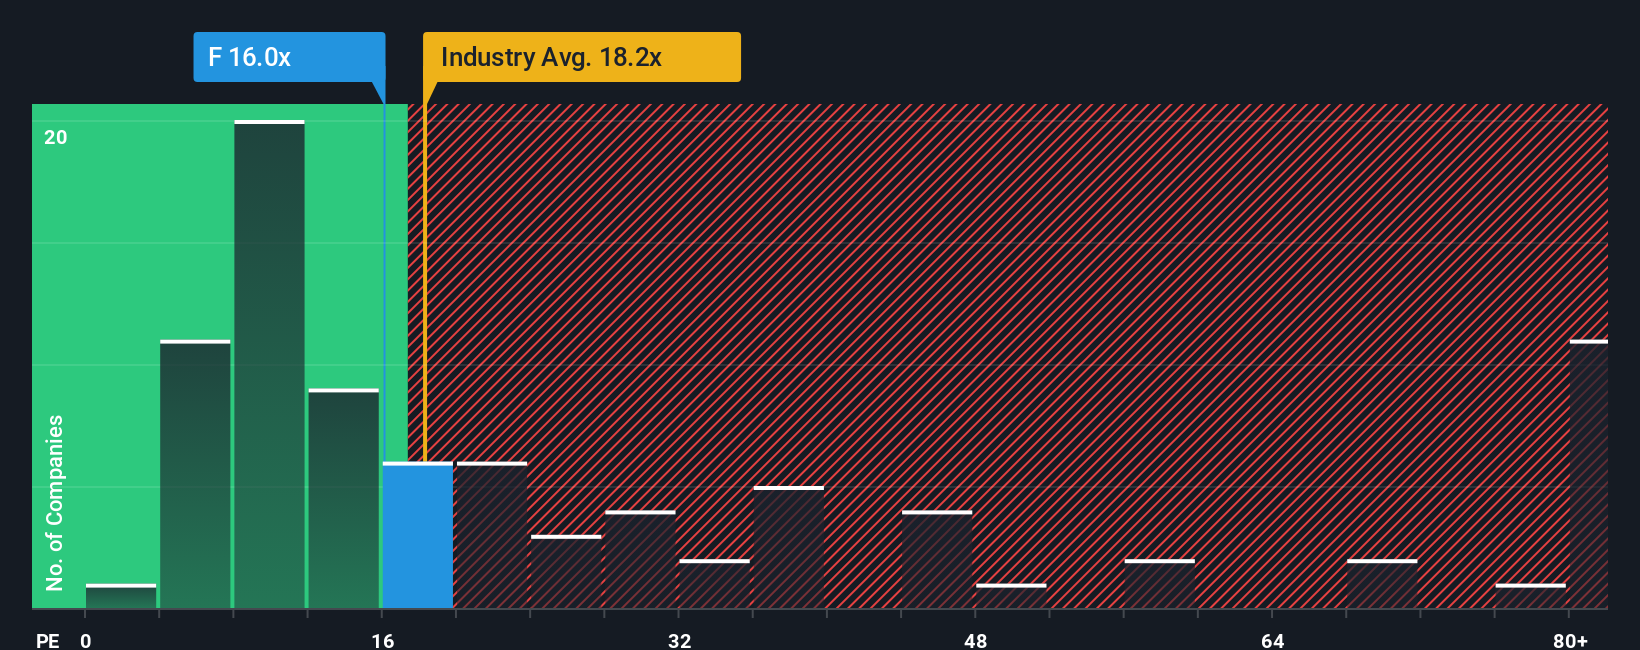
For a company that is generating earnings, the P/E ratio is a straightforward way to connect what you pay for the stock with what the business is currently earning per share. Investors often look at P/E as a quick sense check of whether they are paying a higher or lower price for each dollar of profit.
What counts as a normal or fair P/E usually reflects how the market views a company’s growth prospects and risk profile. Higher expected earnings growth or lower perceived risk can justify a higher P/E, while slower growth or higher risk tends to anchor the multiple lower.
Ford Motor currently trades on a P/E of 11.68x. That sits below the Auto industry average of about 18.20x and the peer group average of about 23.85x. Simply Wall St also calculates a proprietary “Fair Ratio” of 28.48x for Ford Motor, which is the P/E level it estimates based on factors such as earnings growth, industry, profit margins, market cap and company specific risks. This Fair Ratio aims to improve on simple peer or industry comparisons by tailoring the expected multiple to the company’s own profile. On this metric, Ford Motor’s current 11.68x P/E is well below the 28.48x Fair Ratio, which indicates that the stock looks undervalued using this approach.
Result: UNDERVALUED
P/E ratios tell one story, but what if the real opportunity lies elsewhere? Discover 1448 companies where insiders are betting big on explosive growth.
Upgrade Your Decision Making: Choose your Ford Motor Narrative
Earlier we mentioned that there is an even better way to understand valuation, so let us introduce you to Narratives. These are simple stories you create about Ford Motor that connect your view of its business to a financial forecast and then to a Fair Value, all within the Simply Wall St Community page that millions of investors use. You can compare that Fair Value to the current price to help decide whether to buy, hold or sell, see your Narrative update automatically when news or earnings arrive, and even see how two investors looking at the same facts about EV division losses, aluminum supply issues, tariff policy and connected vehicle growth can land on very different Fair Values. For example, one investor might lean toward a Fair Value close to the higher analyst target of US$16.00, while another, more cautious about risks like warranty costs and EV uncertainty, might anchor nearer the lower target of US$8.00, with both views clearly tied back to their revenue, margin and P/E assumptions.
Do you think there's more to the story for Ford Motor? Head over to our Community to see what others are saying!
This article by Simply Wall St is general in nature. We provide commentary based on historical data and analyst forecasts only using an unbiased methodology and our articles are not intended to be financial advice. It does not constitute a recommendation to buy or sell any stock, and does not take account of your objectives, or your financial situation. We aim to bring you long-term focused analysis driven by fundamental data. Note that our analysis may not factor in the latest price-sensitive company announcements or qualitative material. Simply Wall St has no position in any stocks mentioned.
Have feedback on this article? Concerned about the content? Get in touch with us directly. Alternatively, email editorial-team@simplywallst.com