
- PREMIUM
- LIVE QUOTES
- INSTITUTIONS
 Index Options
 State Street
 CME Group
 Nasdaq
 Cboe
Cboe TradingView
 Wall Street Journal
Is It Too Early To Reconsider Texas Instruments (TXN) After Recent Share Price Gains?
- If you are wondering whether Texas Instruments is reasonably priced at its current level, this overview will help you size up the stock before you think about your next move.
- The shares recently closed at US$192.08, with returns of 9.5% over 7 days, 5.2% over 30 days, 8.2% year to date, 3.2% over 1 year, 17.9% over 3 years and 28.5% over 5 years.
- Recent coverage around Texas Instruments has focused on its position in analog and embedded semiconductors and how investors view that exposure relative to broader chip sector trends. This context helps frame why the stock’s shorter term returns differ from its longer term record.
- Right now, Texas Instruments scores 2 out of 6 on our valuation checks, as shown in this valuation summary. Next we will look at how different valuation methods line up on the stock before finishing with a way to think about value that goes beyond the usual ratios.
Texas Instruments scores just 2/6 on our valuation checks. See what other red flags we found in the full valuation breakdown.
Approach 1: Texas Instruments Discounted Cash Flow (DCF) Analysis
A Discounted Cash Flow, or DCF, model looks at the cash Texas Instruments is expected to generate in the future and discounts those amounts back to what they are worth today.
For Texas Instruments, the latest twelve month free cash flow is about $2.0b. Analysts and model estimates project free cash flow rising to $10.3b by 2030, with a set of annual cash flow projections in between. Analysts typically provide forecasts for up to five years, and the later years in this model are extrapolated using Simply Wall St assumptions based on the earlier period.
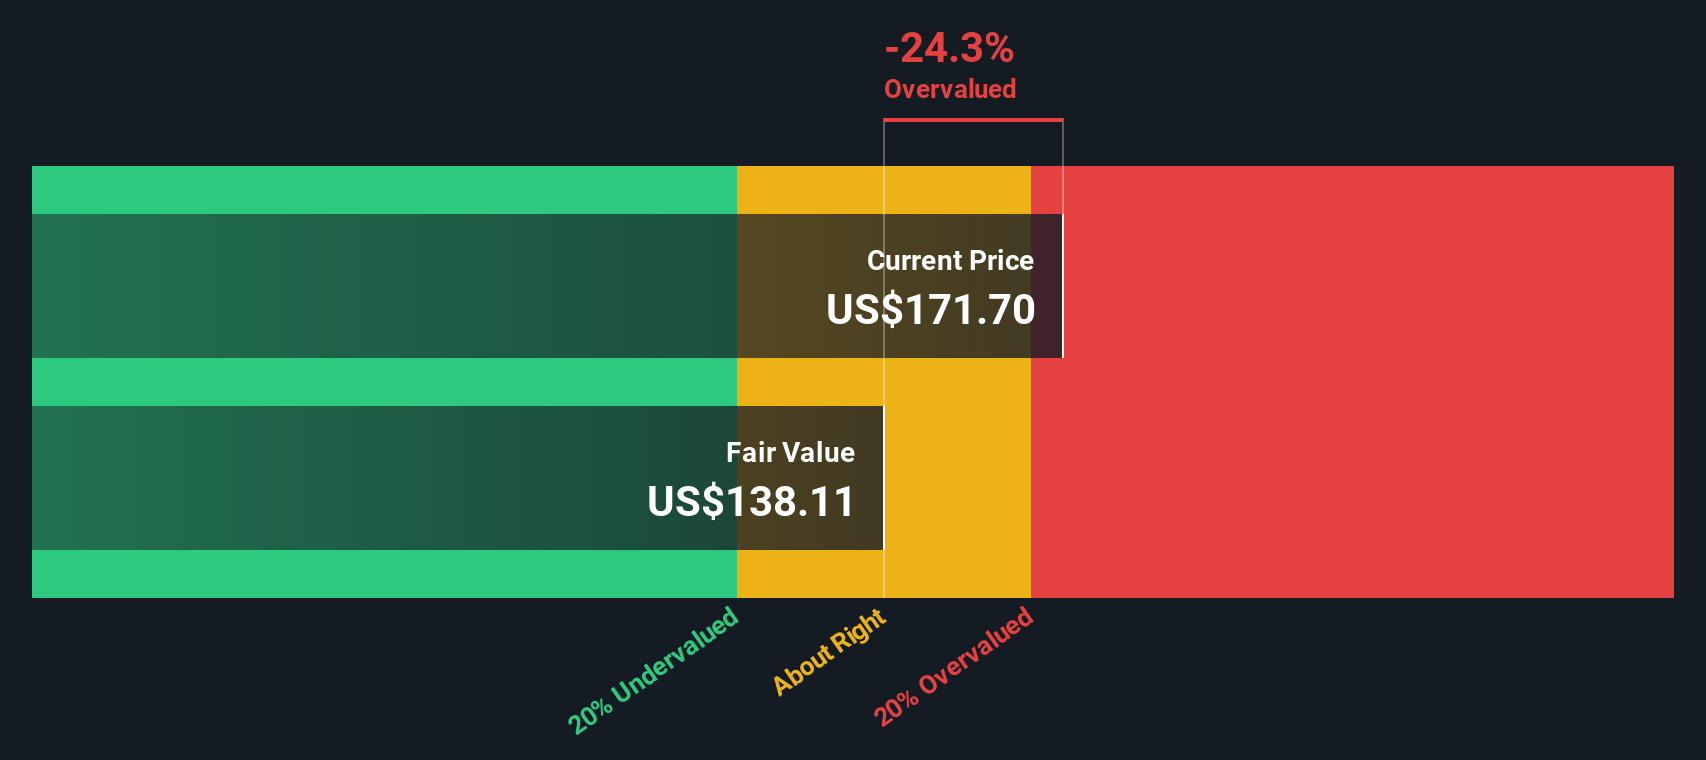
Using these projected cash flows and discounting them back to today in a 2 Stage Free Cash Flow to Equity model, the DCF output suggests an estimated intrinsic value of about $136.34 per share. Compared with the recent share price of $192.08, this implies the stock is about 40.9% above the model’s estimate of fair value. On this measure, Texas Instruments screens as expensive.
Result: OVERVALUED
Our Discounted Cash Flow (DCF) analysis suggests Texas Instruments may be overvalued by 40.9%. Discover 875 undervalued stocks or create your own screener to find better value opportunities.
Approach 2: Texas Instruments Price vs Earnings
For a profitable company like Texas Instruments, the P/E ratio is a useful quick check because it ties what you pay directly to the earnings the business is currently generating. In general, higher expected earnings growth and lower perceived risk can support a higher P/E, while slower growth or higher risk can justify a lower one.
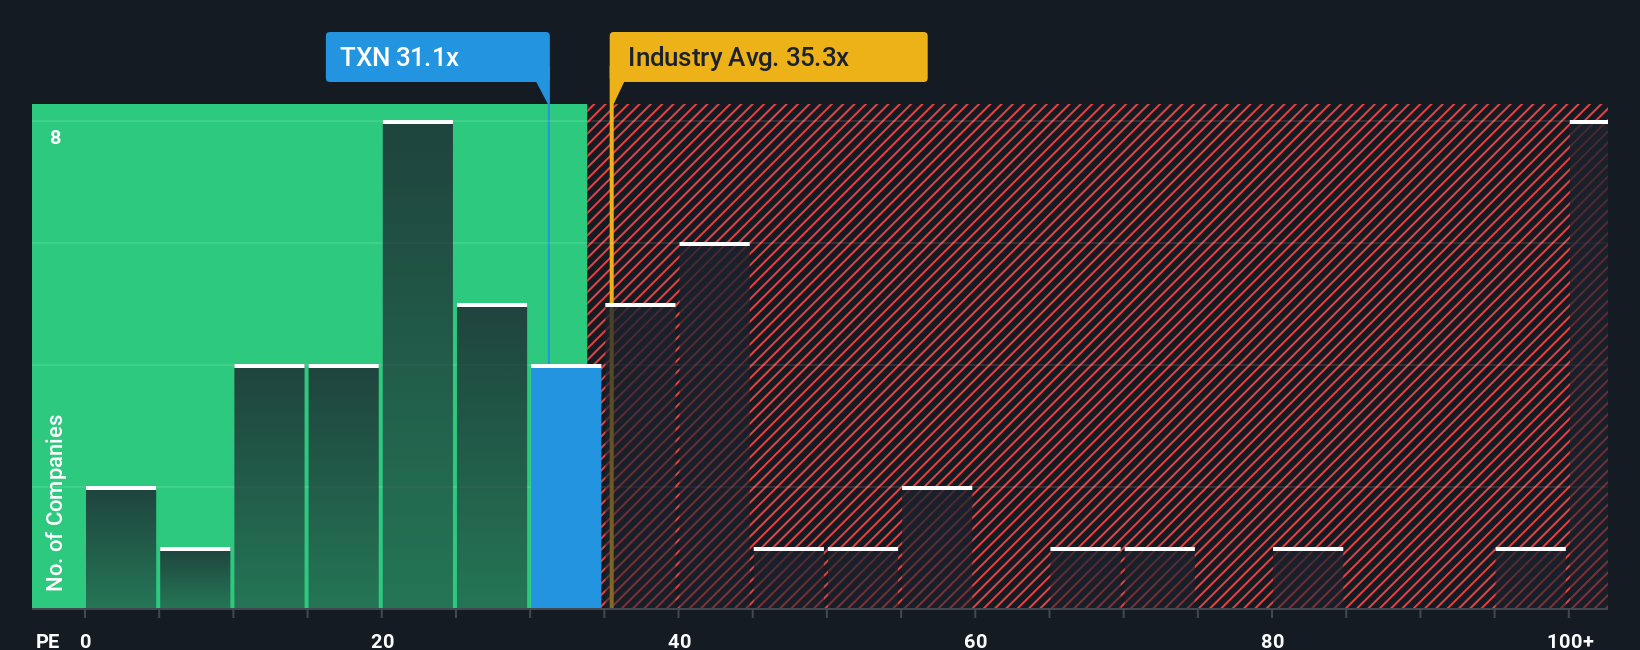
Texas Instruments is trading on a P/E of 34.79x. That sits below the peer group average of 69.05x and also below the broader Semiconductor industry average of 38.66x. On the surface, that might suggest the shares are on a more moderate earnings multiple than many similar names.
Simply Wall St’s Fair Ratio for Texas Instruments is 29.45x. This is a proprietary estimate of what a reasonable P/E could be for the company after considering its earnings growth profile, profitability, risk characteristics, industry classification and market cap. Because it is tailored to the company, the Fair Ratio can be more informative than a simple comparison with peers or the industry, which may have very different growth rates, margins or risk levels. With the actual P/E above the Fair Ratio, the shares screen as expensive on this metric.
Result: OVERVALUED
P/E ratios tell one story, but what if the real opportunity lies elsewhere? Discover 1448 companies where insiders are betting big on explosive growth.
Upgrade Your Decision Making: Choose your Texas Instruments Narrative
Earlier we mentioned that there is an even better way to understand valuation, so let us introduce you to Narratives, which let you attach a clear story about Texas Instruments to your own numbers for future revenue, earnings, margins and fair value, then track how that story stacks up against the current share price.
A Narrative links three pieces together: the business story you believe, the financial forecast that follows from that story, and the fair value that falls out of those assumptions, so you can see in one place why you think the stock is cheap, expensive, or about right.
On Simply Wall St, Narratives sit in the Community page and are used by millions of investors. They stay current because when new information arrives, such as earnings or sector news, the fair value view is refreshed and your own Narrative can be updated or rethought without rebuilding everything from scratch.
For example, one Texas Instruments Narrative might lean closer to the higher fair value estimate of about US$245 based on stronger growth and margins, while another might sit nearer the lower fair value of about US$141 based on more cautious assumptions. Comparing either of those fair values to the latest share price can help you decide whether the stock currently looks more like a buy, a hold, or a sell for your approach.
For Texas Instruments, however, we will make it really easy for you with previews of two leading Texas Instruments Narratives:
Fair value in this bullish Narrative: US$245.00 per share
Implied discount to this fair value at the recent US$192.08 share price: about 21.6% undervalued
Revenue growth assumption used in this Narrative: 15.86% a year
- Assumes Texas Instruments benefits from earlier US manufacturing investment, supportive policy and higher margin contracts that could lift long term profitability.
- Builds in faster growth from AI infrastructure and smart, connected devices that use more analog and embedded chips per product.
- Recognises risks from geopolitics, capital intensity and potential commoditisation of analog products that could challenge those optimistic outcomes.
Fair value in this more conservative Narrative: about US$188.92 per share
Implied premium to this fair value at the recent US$192.08 share price: about 1.7% overvalued
Revenue growth assumption used in this Narrative: 9.45% a year
- Frames Texas Instruments as a steady industrial and automotive chip supplier with a focus on long life, high margin products rather than aggressive growth.
- Assumes solid but more moderate revenue and margin expansion, with the share price closer to what these analysts view as a central fair value range.
- Highlights risks around competition in analog, high capital spending, tariff and trade uncertainty, and sensitivity to industrial and auto cycles.
Putting those side by side, you can decide whether your own expectations line up closer to the higher growth, higher fair value view or the more measured outlook that sits near the current price. If you want to go deeper, pick the Narrative that feels closest to your thinking and adjust the numbers to see how your version of the Texas Instruments story changes the implied value.
Curious how numbers become stories that shape markets? Explore Community Narratives
Do you think there's more to the story for Texas Instruments? Head over to our Community to see what others are saying!

This article by Simply Wall St is general in nature. We provide commentary based on historical data and analyst forecasts only using an unbiased methodology and our articles are not intended to be financial advice. It does not constitute a recommendation to buy or sell any stock, and does not take account of your objectives, or your financial situation. We aim to bring you long-term focused analysis driven by fundamental data. Note that our analysis may not factor in the latest price-sensitive company announcements or qualitative material. Simply Wall St has no position in any stocks mentioned.
Have feedback on this article? Concerned about the content? Get in touch with us directly. Alternatively, email editorial-team@simplywallst.com