
- PREMIUM
- LIVE QUOTES
- INSTITUTIONS
 Index Options
 State Street
 CME Group
 Nasdaq
 Cboe
Cboe TradingView
 Wall Street Journal
Is Palantir Technologies (PLTR) Pricing Still Justified After A 149% One Year Surge
- If you are wondering whether Palantir Technologies' current share price still makes sense, the key question is how that price lines up with the underlying value of the business.
- The stock closed at US$174.04, with a 3.8% decline over the last 7 days and a 4.2% decline over 30 days, while the 1 year return sits at 148.7% and the 3 year return is very large.
- Recent coverage around Palantir has focused on its role in data analytics and software for government and commercial clients, as well as ongoing debate about how its long term contracts should be reflected in expectations. This mix of attention on its business model and contract pipeline helps frame how investors think about both risk and potential reward at the current price.
- Despite the strong long term share price performance, Palantir currently scores 0 out of 6 on Simply Wall St's valuation checks, as shown in its valuation score. Next, we will look at how different methods assess that price, and then finish with a way of thinking about valuation that goes beyond any single model.
Palantir Technologies scores just 0/6 on our valuation checks. See what other red flags we found in the full valuation breakdown.
Approach 1: Palantir Technologies Discounted Cash Flow (DCF) Analysis
A Discounted Cash Flow, or DCF, model estimates what a business could be worth today by projecting its future cash flows and then discounting those back to a single present value figure.
For Palantir Technologies, the model used is a 2 Stage Free Cash Flow to Equity approach. The latest twelve month free cash flow stands at about $1.79b. Analyst estimates and Simply Wall St extrapolations then project free cash flow rising to $10.36b in 2030, with interim yearly projections between 2026 and 2035 all expressed in the billions of dollars.
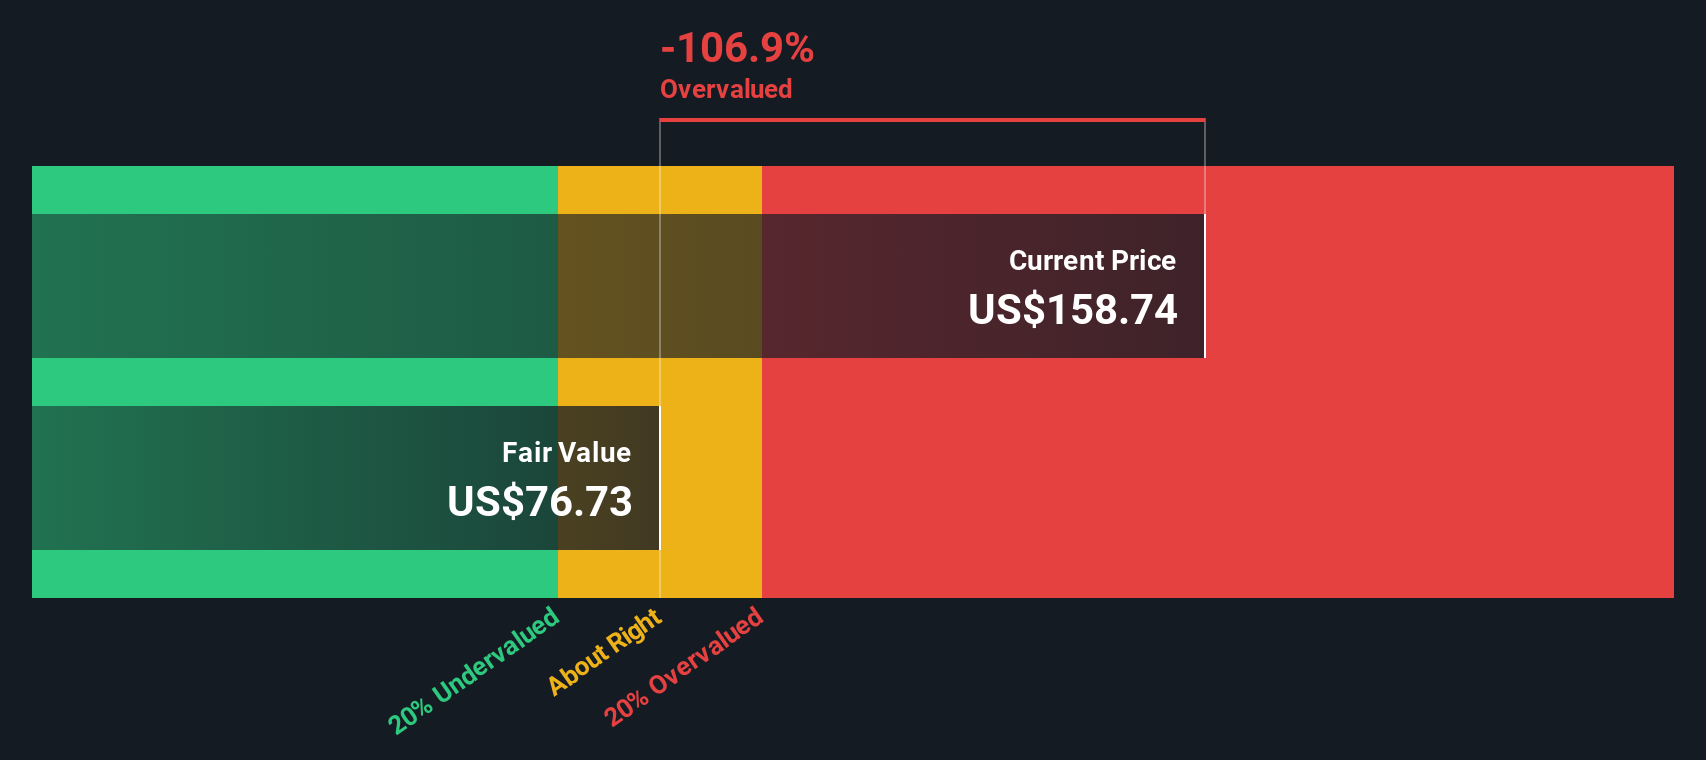
When all those projected cash flows are discounted back to today, the model arrives at an estimated intrinsic value of $94.83 per share. Compared to the current share price of $174.04, that implies the stock is about 83.5% overvalued according to this specific DCF framework.
This does not mean the market must be wrong, but it does suggest that, on these cash flow assumptions, expectations reflected in the share price are very demanding.
Result: OVERVALUED
Our Discounted Cash Flow (DCF) analysis suggests Palantir Technologies may be overvalued by 83.5%. Discover 882 undervalued stocks or create your own screener to find better value opportunities.
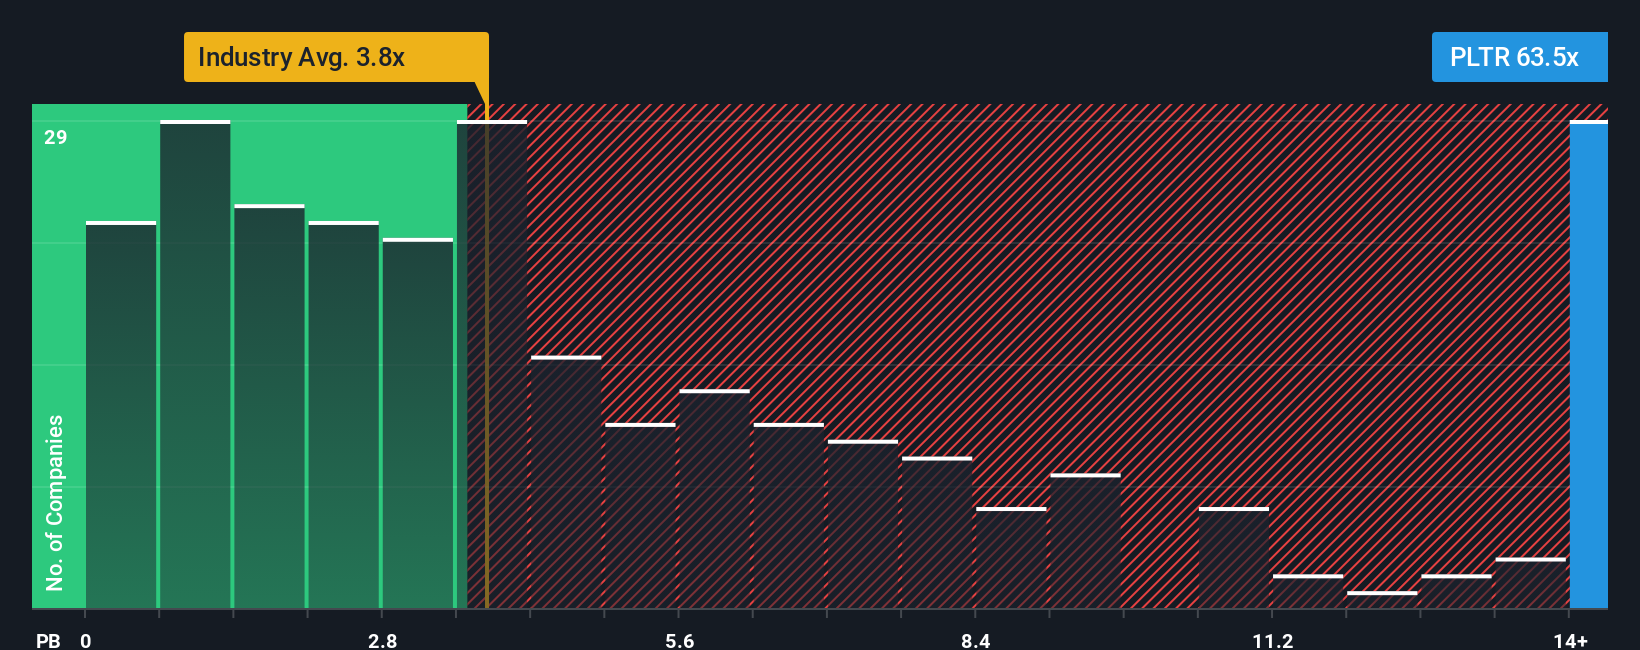
Approach 2: Palantir Technologies Price vs Book
For profitable companies with meaningful equity on their balance sheet, the Price to Book, or P/B, ratio can be a useful sense check, because it compares what the market is paying to the accounting value of net assets.
What counts as a “normal” P/B often reflects how the market views a company’s growth potential and risk. Higher expected growth or stronger perceived resilience can support a higher multiple, while higher risk or weaker profitability tends to push a fair P/B lower.
Palantir is currently trading on a P/B of 62.94x. That stands well above the Software industry average P/B of 3.37x and also above the peer group average of 42.55x. Simply Wall St also looks at a proprietary “Fair Ratio” for P/B, which estimates what multiple might be reasonable after factoring in elements like earnings growth, profit margins, industry, market cap and specific risks.
This Fair Ratio is designed to be more tailored than a simple peer or industry comparison, because it adjusts for Palantir’s own characteristics rather than assuming it should trade in line with broad benchmarks. As no Fair Ratio is provided here, the current 62.94x multiple cannot be directly compared to that model, but it clearly sits far above the wider industry markers.
Result: OVERVALUED
P/B ratios tell one story, but what if the real opportunity lies elsewhere? Discover 1450 companies where insiders are betting big on explosive growth.
Upgrade Your Decision Making: Choose your Palantir Technologies Narrative
Earlier we mentioned that there is an even better way to understand valuation, so let us introduce you to Narratives. These are simply your own story about a company that links what you believe about its business to a financial forecast and, ultimately, to a fair value you can compare with today’s price.
On Simply Wall St, Narratives live inside the Community page and give you an easy way to set your assumptions for Palantir Technologies' future revenue, earnings and margins. You can then see how those inputs translate into a fair value that updates automatically when new information such as earnings releases or major news is added.
Investors can then compare this Fair Value to the current market price to help decide whether to buy, hold, or sell. Each Narrative clearly ties the qualitative story to the numbers rather than treating them separately.
For example, one Palantir Technologies Narrative on Simply Wall St assumes a fair value of US$153.97 with revenue growth of 39%, a profit margin of 38% and a future P/E of 92x. Another assumes a fair value of US$66.00 with revenue growth of 11.95%, a profit margin of 18.0087% and a future P/E of 314.381544x, showing how different views on the same company can lead to very different conclusions.
Do you think there's more to the story for Palantir Technologies? Head over to our Community to see what others are saying!

This article by Simply Wall St is general in nature. We provide commentary based on historical data and analyst forecasts only using an unbiased methodology and our articles are not intended to be financial advice. It does not constitute a recommendation to buy or sell any stock, and does not take account of your objectives, or your financial situation. We aim to bring you long-term focused analysis driven by fundamental data. Note that our analysis may not factor in the latest price-sensitive company announcements or qualitative material. Simply Wall St has no position in any stocks mentioned.
Have feedback on this article? Concerned about the content? Get in touch with us directly. Alternatively, email editorial-team@simplywallst.com