
- PREMIUM
- LIVE QUOTES
- INSTITUTIONS
 Index Options
 State Street
 CME Group
 Nasdaq
 Cboe
Cboe TradingView
 Wall Street Journal
Is It Time To Reassess TotalEnergies (ENXTPA:TTE) After Recent Share Price Weakness?
- If you are wondering whether TotalEnergies is attractively priced right now, the key question is whether the current share price reflects its underlying cash generation and asset base.
- The stock last closed at €55.04, with a 7 day return of 2.4% decline, a 30 day return of 2.4% decline, year to date return of 1.9% decline, and a 1 year return of 6.4%, while the 3 year return sits at 10.9% and the 5 year return at 100.5%.
- Recent price moves have come alongside ongoing attention on large integrated energy companies and their capital allocation between fossil fuel projects and low carbon initiatives. For TotalEnergies, recent headlines have focused on its positioning among European energy peers and investor interest in how it balances shareholder returns with long term transition spending.
- Our valuation checks give TotalEnergies a score of 5/6, which sets up a closer look at how different methods, such as discounted cash flows and market multiples, stack up against each other and hints at an even more rounded way to think about value that we will come back to at the end of this article.
Find out why TotalEnergies's 6.4% return over the last year is lagging behind its peers.
Approach 1: TotalEnergies Discounted Cash Flow (DCF) Analysis
A Discounted Cash Flow, or DCF, model estimates what a business could be worth today by projecting its future cash flows and discounting them back to a present value.
For TotalEnergies, the model used is a 2 Stage Free Cash Flow to Equity approach based on cash flow projections. The company’s last twelve month free cash flow is about US$14.2b, and analysts plus modelled estimates project free cash flow of US$19.9b in 2030. Between 2026 and 2035, the model uses a mix of analyst forecasts and extrapolated figures from Simply Wall St to build a ten year cash flow path, all converted into present values.
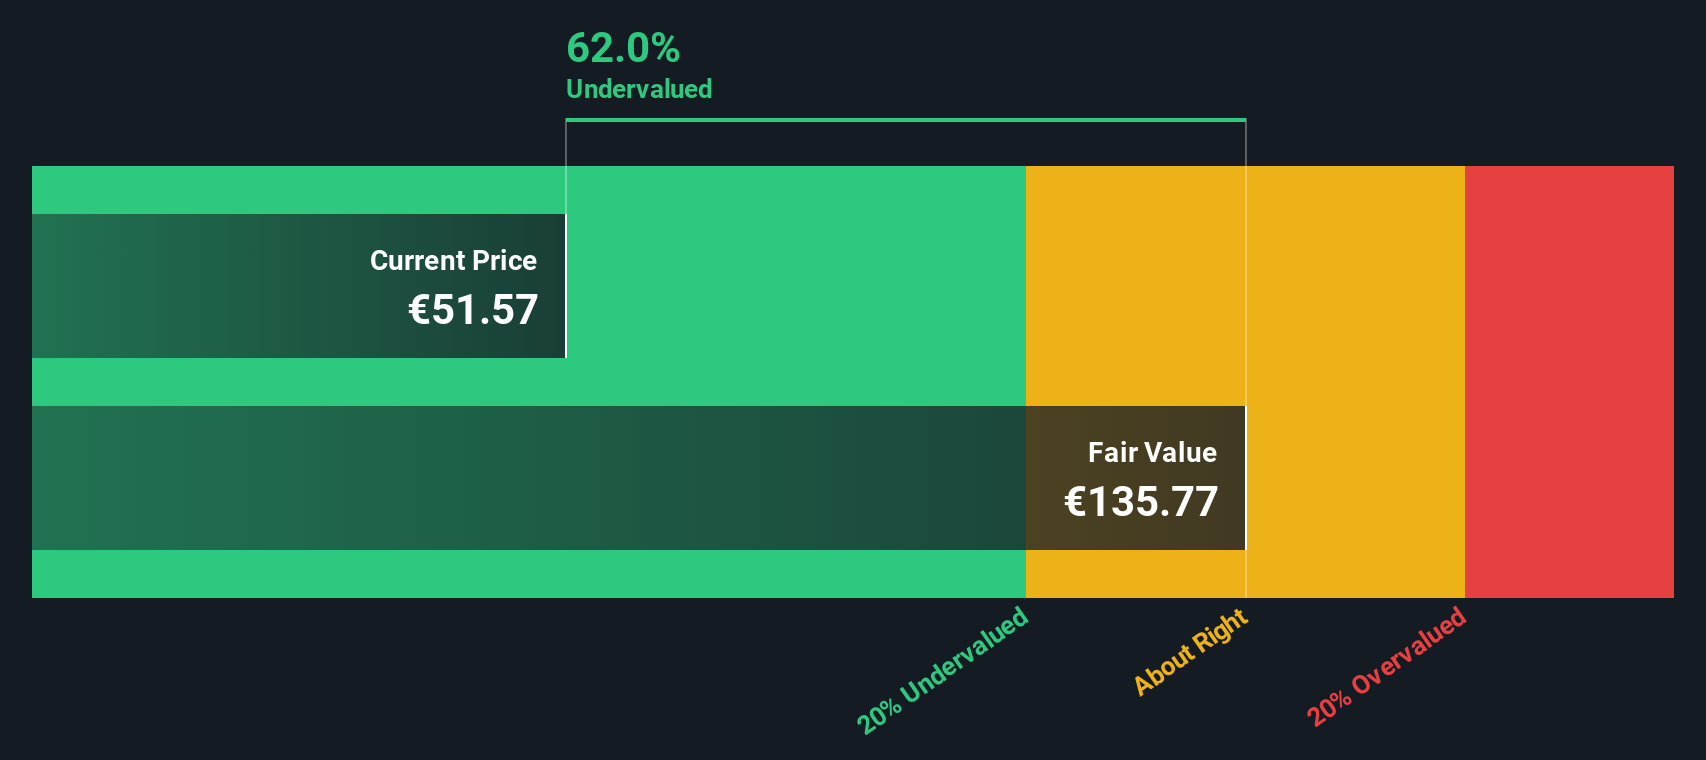
Adding these discounted cash flows produces an estimated intrinsic value of €202.38 per share. Against the recent share price of €55.04, this implies a 72.8% discount, which points to the stock being significantly undervalued on this DCF view.
Result: UNDERVALUED
Our Discounted Cash Flow (DCF) analysis suggests TotalEnergies is undervalued by 72.8%. Track this in your watchlist or portfolio, or discover 882 more undervalued stocks based on cash flows.
Approach 2: TotalEnergies Price vs Earnings
For a profitable company like TotalEnergies, the P/E ratio is a useful gauge because it links what you pay for the stock to the earnings the business is currently generating.
In general, higher growth expectations and lower perceived risk can support a higher “normal” or “fair” P/E ratio, while slower growth or higher risk usually align with a lower multiple. That context helps when you compare any single company with its sector.
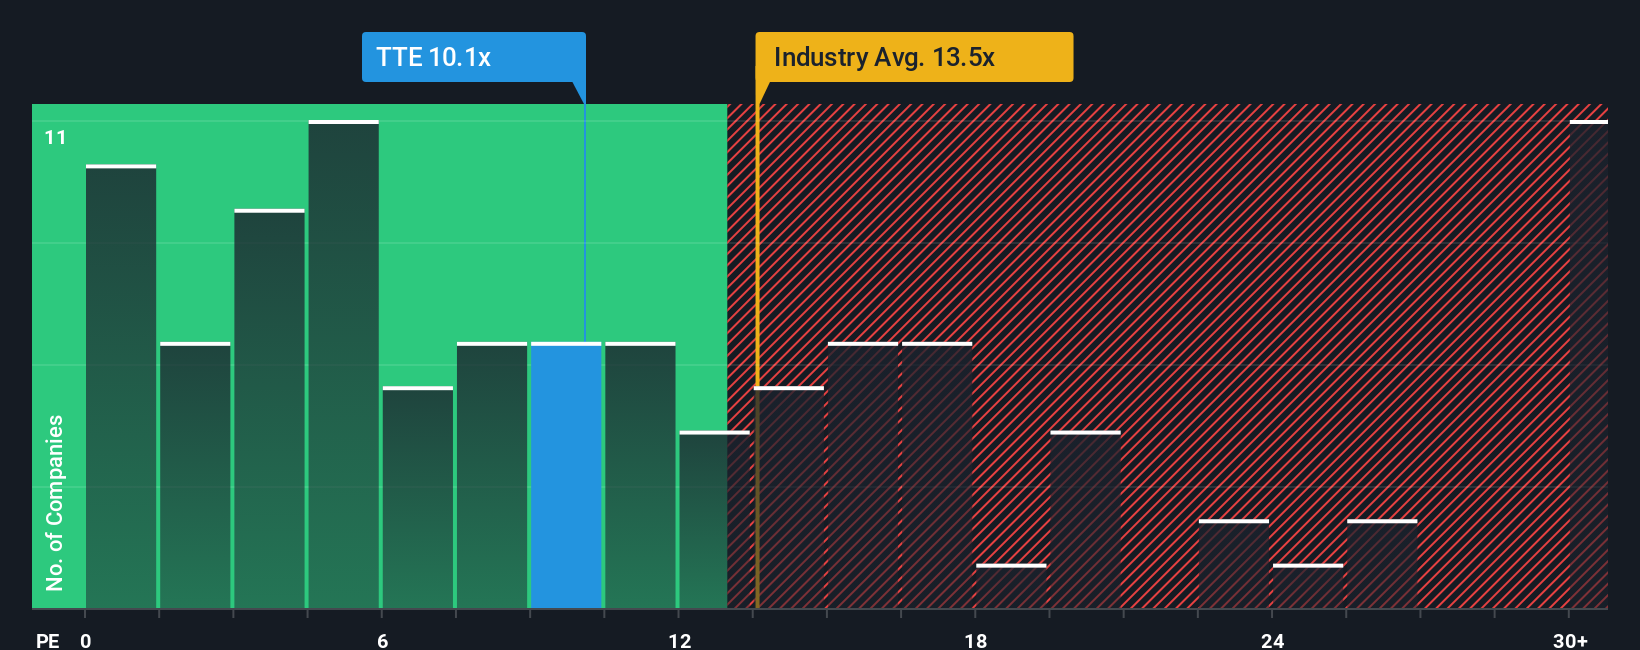
TotalEnergies currently trades on a P/E of 9.73x. This sits below the Oil and Gas industry average P/E of about 13.45x and below the broader peer average of 23.12x. On simple comparisons, the stock looks cheaper than many peers on earnings.
Simply Wall St’s Fair Ratio for TotalEnergies is 17.66x. This is a proprietary estimate of what the P/E might be, given factors such as earnings growth profile, industry, profit margins, market cap and key risks. Because it adjusts for these company specific drivers rather than just lining up against broad peer or industry averages, it can be a more tailored reference point.
Comparing the Fair Ratio of 17.66x with the current P/E of 9.73x suggests the shares trade below that implied level.
Result: UNDERVALUED
P/E ratios tell one story, but what if the real opportunity lies elsewhere? Discover 1450 companies where insiders are betting big on explosive growth.
Upgrade Your Decision Making: Choose your TotalEnergies Narrative
Earlier we mentioned that there is an even better way to understand valuation, so let us introduce you to Narratives, a simple tool on Simply Wall St’s Community page that lets you connect your view of TotalEnergies’ story with a set of forecasts for revenue, earnings and margins. You can then link those forecasts to a Fair Value, compare that Fair Value with today’s price to help you decide whether you see the stock as attractive or expensive, and have that view automatically updated when new earnings or news emerge. For example, a bullish Narrative might look closer to the higher analyst fair value around €77.57, while a more cautious Narrative might sit nearer the lower end around €52.82. This reflects how different investors can look at the same company and reach different, but clearly quantified, conclusions.
Do you think there's more to the story for TotalEnergies? Head over to our Community to see what others are saying!

This article by Simply Wall St is general in nature. We provide commentary based on historical data and analyst forecasts only using an unbiased methodology and our articles are not intended to be financial advice. It does not constitute a recommendation to buy or sell any stock, and does not take account of your objectives, or your financial situation. We aim to bring you long-term focused analysis driven by fundamental data. Note that our analysis may not factor in the latest price-sensitive company announcements or qualitative material. Simply Wall St has no position in any stocks mentioned.
Have feedback on this article? Concerned about the content? Get in touch with us directly. Alternatively, email editorial-team@simplywallst.com