
- PREMIUM
- LIVE QUOTES
- INSTITUTIONS
 Index Options
 State Street
 CME Group
 Nasdaq
 Cboe
Cboe TradingView
 Wall Street Journal
Is Starwood Property Trust (STWD) Trading Too Rich After Steady Multi Year Share Price Gains
- If you are wondering whether Starwood Property Trust is attractively priced right now, you are not alone. The stock often comes up for income focused investors who also care about valuation.
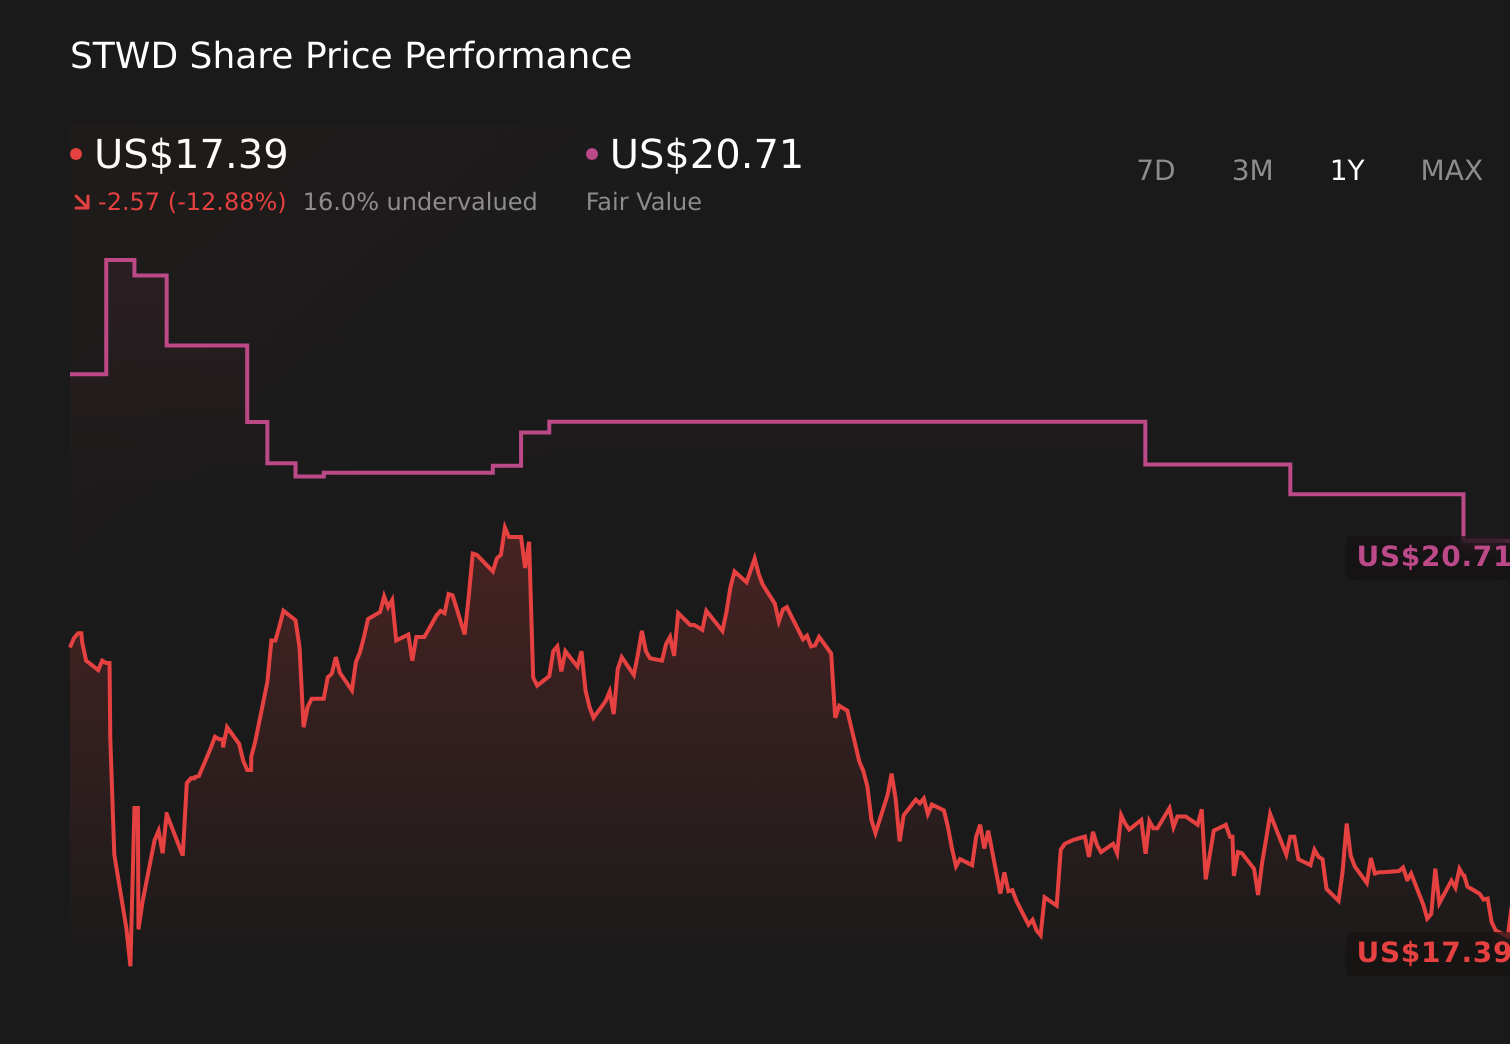
- Over the short term, the share price has been relatively steady, with a 0.7% decline over the last 7 days, a 1.3% gain over 30 days, a 0.3% return year to date, and longer term returns of 7.4% over 1 year, 28.3% over 3 years, and 54.9% over 5 years.
- Recent coverage of Starwood Property Trust has focused on its role as a publicly traded real estate finance company and its positioning in the listed mortgage REIT space, which often shapes how investors think about risk and income. Commentary has also highlighted how income oriented names can see sentiment shifts as interest rate expectations change, giving context to the stock's recent return profile.
- On our valuation checks, Starwood Property Trust currently scores 0 out of 6. This raises fair questions about how the market is pricing its cash flows, assets, and risk. Next we will walk through the standard valuation approaches investors often use, then finish with a framework that can help you make even better sense of what that score really means.
Starwood Property Trust scores just 0/6 on our valuation checks. See what other red flags we found in the full valuation breakdown.
Approach 1: Starwood Property Trust Excess Returns Analysis
The Excess Returns model looks at how much value a company creates over and above the return that equity investors require. Instead of focusing on cash flows, it compares the earnings the business generates on its equity base with the cost of that equity.
For Starwood Property Trust, the model uses a Book Value of $18.54 per share and a Stable EPS of $1.04 per share, based on the median return on equity from the past 5 years. The Average Return on Equity is 5.84%, while the Cost of Equity is $1.63 per share. That combination leads to an Excess Return of $0.59 per share, meaning the earnings used in this framework do not exceed the required return implied by the model. The Stable Book Value input is $17.78 per share, based on weighted future book value estimates from 4 analysts.
Taking these inputs together, the Excess Returns model produces an intrinsic value of $7.75 per share. Compared with the current share price, this implies the stock is 138.3% overvalued under this method.
Result: OVERVALUED
Our Excess Returns analysis suggests Starwood Property Trust may be overvalued by 138.3%. Discover 882 undervalued stocks or create your own screener to find better value opportunities.
Approach 2: Starwood Property Trust Price vs Earnings
P/E is a common way to value profitable companies, because it links what you pay for each share directly to the earnings that share currently generates. For income focused names like mortgage REITs, it gives a quick sense of how much investors are paying for each dollar of profit.
In general, higher growth expectations and lower perceived risk can support a higher “normal” or “fair” P/E, while slower expected growth or higher risk often go with a lower multiple. That is why simple comparisons can be tricky.
Starwood Property Trust currently trades on a P/E of 19.12x. That is above the Mortgage REITs industry average of about 12.36x and also above the peer group average of 15.11x. Simply Wall St’s Fair Ratio framework estimates what a P/E could look like after accounting for factors such as earnings growth characteristics, industry, profit margins, market cap and specific risks. Because it blends these inputs together, the Fair Ratio of 14.31x can be more tailored than a basic peer or industry comparison.
Comparing the current 19.12x P/E with the 14.31x Fair Ratio suggests Starwood Property Trust is trading at a richer level than this framework would point to.
Result: OVERVALUED

P/E ratios tell one story, but what if the real opportunity lies elsewhere? Discover 1450 companies where insiders are betting big on explosive growth.
Upgrade Your Decision Making: Choose your Starwood Property Trust Narrative
Earlier we mentioned that there is an even better way to understand valuation, so let us introduce you to Narratives. These are simply your story about Starwood Property Trust, linked to numbers such as your own fair value and assumptions for future revenue, earnings and margins. They are then tied to a forecast and fair value that you can compare directly with the current share price to help decide when you might buy or sell. All of this sits within Simply Wall St’s Community page, where Narratives are refreshed when new information such as news or earnings is added. For example, one investor might build a more optimistic Starwood Property Trust view around stable income and diversified lending, while another focuses on credit risk, nonaccrual assets and funding dependence. This can result in different fair values even though they are looking at the same company.
Do you think there's more to the story for Starwood Property Trust? Head over to our Community to see what others are saying!
This article by Simply Wall St is general in nature. We provide commentary based on historical data and analyst forecasts only using an unbiased methodology and our articles are not intended to be financial advice. It does not constitute a recommendation to buy or sell any stock, and does not take account of your objectives, or your financial situation. We aim to bring you long-term focused analysis driven by fundamental data. Note that our analysis may not factor in the latest price-sensitive company announcements or qualitative material. Simply Wall St has no position in any stocks mentioned.
Have feedback on this article? Concerned about the content? Get in touch with us directly. Alternatively, email editorial-team@simplywallst.com