
- PREMIUM
- LIVE QUOTES
- INSTITUTIONS
 Index Options
 State Street
 CME Group
 Nasdaq
 Cboe
Cboe TradingView
 Wall Street Journal
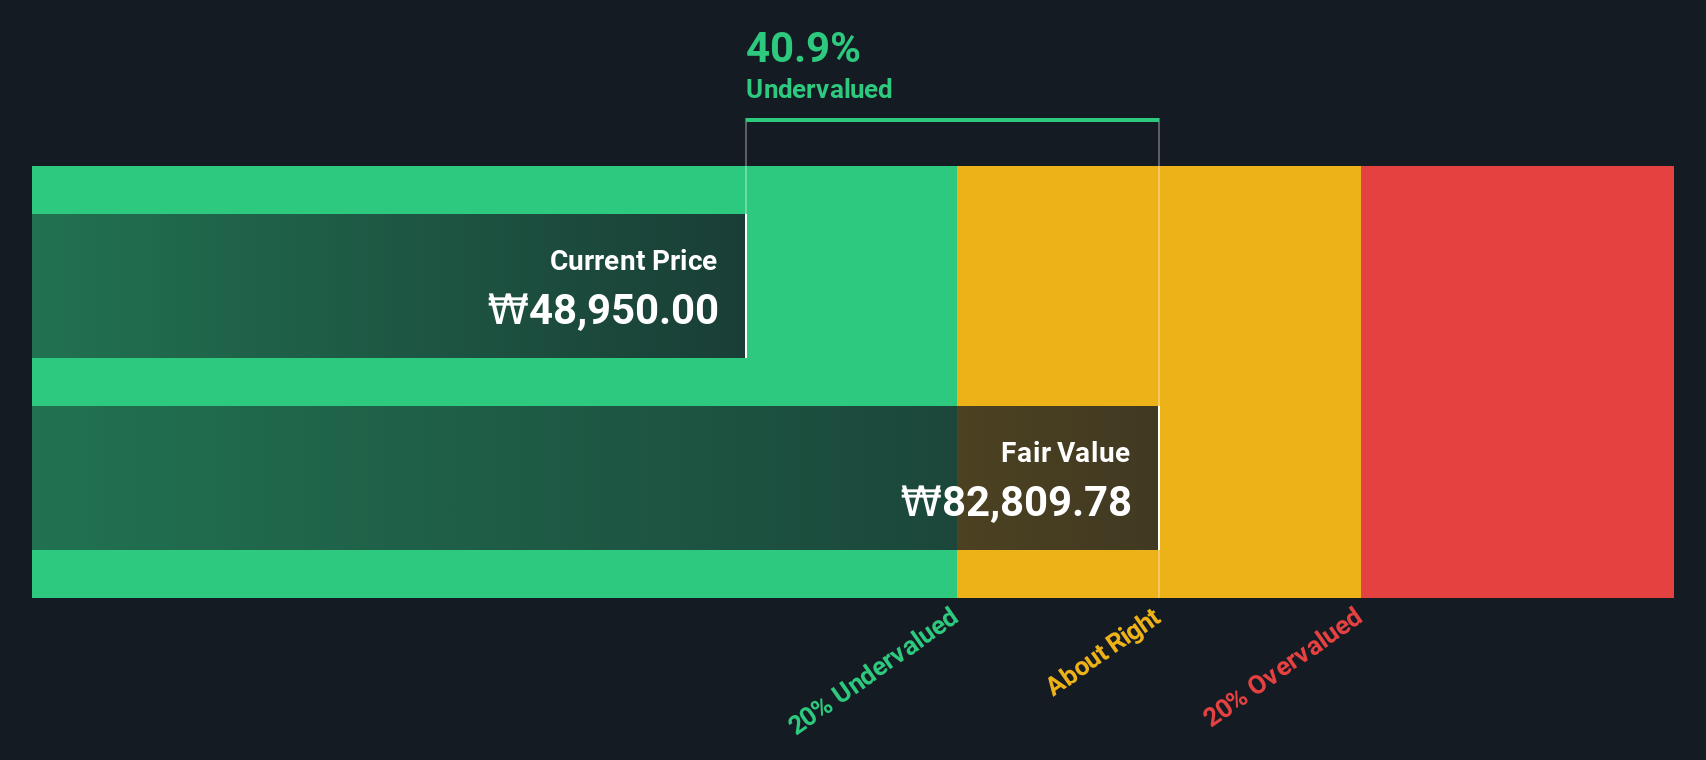
Are Investors Undervaluing Posco International Corporation (KRX:047050) By 41%?
Key Insights
- The projected fair value for Posco International is ₩82,810 based on 2 Stage Free Cash Flow to Equity
- Current share price of ₩48,950 suggests Posco International is potentially 41% undervalued
- Analyst price target for A047050 is ₩68,889 which is 17% below our fair value estimate
How far off is Posco International Corporation (KRX:047050) from its intrinsic value? Using the most recent financial data, we'll take a look at whether the stock is fairly priced by estimating the company's future cash flows and discounting them to their present value. We will use the Discounted Cash Flow (DCF) model on this occasion. There's really not all that much to it, even though it might appear quite complex.
Companies can be valued in a lot of ways, so we would point out that a DCF is not perfect for every situation. Anyone interested in learning a bit more about intrinsic value should have a read of the Simply Wall St analysis model.
The Method
We use what is known as a 2-stage model, which simply means we have two different periods of growth rates for the company's cash flows. Generally the first stage is higher growth, and the second stage is a lower growth phase. In the first stage we need to estimate the cash flows to the business over the next ten years. Where possible we use analyst estimates, but when these aren't available we extrapolate the previous free cash flow (FCF) from the last estimate or reported value. We assume companies with shrinking free cash flow will slow their rate of shrinkage, and that companies with growing free cash flow will see their growth rate slow, over this period. We do this to reflect that growth tends to slow more in the early years than it does in later years.
A DCF is all about the idea that a dollar in the future is less valuable than a dollar today, so we need to discount the sum of these future cash flows to arrive at a present value estimate:
10-year free cash flow (FCF) forecast
| 2026 | 2027 | 2028 | 2029 | 2030 | 2031 | 2032 | 2033 | 2034 | 2035 | |
| Levered FCF (₩, Millions) | ₩472.5b | ₩483.4b | ₩845.0b | ₩999.1b | ₩1.09t | ₩1.16t | ₩1.22t | ₩1.27t | ₩1.32t | ₩1.37t |
| Growth Rate Estimate Source | Analyst x6 | Analyst x5 | Analyst x1 | Analyst x1 | Analyst x1 | Est @ 6.30% | Est @ 5.30% | Est @ 4.60% | Est @ 4.11% | Est @ 3.77% |
| Present Value (₩, Millions) Discounted @ 9.7% | ₩430.6k | ₩401.4k | ₩639.4k | ₩688.9k | ₩682.8k | ₩661.4k | ₩634.7k | ₩604.9k | ₩573.9k | ₩542.7k |
("Est" = FCF growth rate estimated by Simply Wall St)
Present Value of 10-year Cash Flow (PVCF) = ₩5.9t
The second stage is also known as Terminal Value, this is the business's cash flow after the first stage. The Gordon Growth formula is used to calculate Terminal Value at a future annual growth rate equal to the 5-year average of the 10-year government bond yield of 3.0%. We discount the terminal cash flows to today's value at a cost of equity of 9.7%.
Terminal Value (TV)= FCF2035 × (1 + g) ÷ (r – g) = ₩1.4t× (1 + 3.0%) ÷ (9.7%– 3.0%) = ₩21t
Present Value of Terminal Value (PVTV)= TV / (1 + r)10= ₩21t÷ ( 1 + 9.7%)10= ₩8.3t
The total value, or equity value, is then the sum of the present value of the future cash flows, which in this case is ₩14t. To get the intrinsic value per share, we divide this by the total number of shares outstanding. Compared to the current share price of ₩49k, the company appears quite good value at a 41% discount to where the stock price trades currently. Valuations are imprecise instruments though, rather like a telescope - move a few degrees and end up in a different galaxy. Do keep this in mind.
Important Assumptions
The calculation above is very dependent on two assumptions. The first is the discount rate and the other is the cash flows. You don't have to agree with these inputs, I recommend redoing the calculations yourself and playing with them. The DCF also does not consider the possible cyclicality of an industry, or a company's future capital requirements, so it does not give a full picture of a company's potential performance. Given that we are looking at Posco International as potential shareholders, the cost of equity is used as the discount rate, rather than the cost of capital (or weighted average cost of capital, WACC) which accounts for debt. In this calculation we've used 9.7%, which is based on a levered beta of 1.371. Beta is a measure of a stock's volatility, compared to the market as a whole. We get our beta from the industry average beta of globally comparable companies, with an imposed limit between 0.8 and 2.0, which is a reasonable range for a stable business.
See our latest analysis for Posco International
SWOT Analysis for Posco International
- Debt is well covered by earnings and cashflows.
- Earnings declined over the past year.
- Dividend is low compared to the top 25% of dividend payers in the Trade Distributors market.
- Annual earnings are forecast to grow for the next 4 years.
- Trading below our estimate of fair value by more than 20%.
- Dividends are not covered by earnings.
- Annual earnings are forecast to grow slower than the South Korean market.
Next Steps:
Valuation is only one side of the coin in terms of building your investment thesis, and it shouldn't be the only metric you look at when researching a company. DCF models are not the be-all and end-all of investment valuation. Rather it should be seen as a guide to "what assumptions need to be true for this stock to be under/overvalued?" For instance, if the terminal value growth rate is adjusted slightly, it can dramatically alter the overall result. What is the reason for the share price sitting below the intrinsic value? For Posco International, we've compiled three essential factors you should look at:
- Risks: For instance, we've identified 3 warning signs for Posco International that you should be aware of.
- Future Earnings: How does A047050's growth rate compare to its peers and the wider market? Dig deeper into the analyst consensus number for the upcoming years by interacting with our free analyst growth expectation chart.
- Other High Quality Alternatives: Do you like a good all-rounder? Explore our interactive list of high quality stocks to get an idea of what else is out there you may be missing!
PS. The Simply Wall St app conducts a discounted cash flow valuation for every stock on the KOSE every day. If you want to find the calculation for other stocks just search here.
Have feedback on this article? Concerned about the content? Get in touch with us directly. Alternatively, email editorial-team (at) simplywallst.com.
This article by Simply Wall St is general in nature. We provide commentary based on historical data and analyst forecasts only using an unbiased methodology and our articles are not intended to be financial advice. It does not constitute a recommendation to buy or sell any stock, and does not take account of your objectives, or your financial situation. We aim to bring you long-term focused analysis driven by fundamental data. Note that our analysis may not factor in the latest price-sensitive company announcements or qualitative material. Simply Wall St has no position in any stocks mentioned.