
- PREMIUM
- LIVE QUOTES
- INSTITUTIONS
 Index Options
 State Street
 CME Group
 Nasdaq
 Cboe
Cboe TradingView
 Wall Street Journal
Old National Bancorp (ONB) Valuation Check After Strong Revenue Beat And Bremer Partnership Impact
Old National Bancorp (ONB) recently reported a 44.9% year on year revenue increase, surpassing analyst forecasts by 2.2%. The company cited its Bremer Bank partnership as a key contributor to this performance.
See our latest analysis for Old National Bancorp.
The recent revenue surprise sits alongside a steady share price backdrop, with the latest close at $22.90 and a 90 day share price return of 4.61%. Over the past year, total shareholder return of 11.64% and 36.48% over three years suggests momentum has been gradually building rather than fading, as investors weigh earnings beats, the upcoming earnings call schedule, legal proceedings with Bell Bank, and shifting institutional positions.
If Old National’s recent move has you thinking about what else might be gaining traction, this could be a good moment to broaden your search into fast growing stocks with high insider ownership.
With ONB trading at $22.90, sitting below the average analyst price target of $25.92 and an indicated intrinsic discount of about 53%, the key question is whether there is genuine value here or if the market is already pricing in future growth.
Most Popular Narrative: 11.1% Undervalued
With Old National Bancorp’s fair value in the most followed narrative sitting at $25.75 against a last close of $22.90, the gap hinges on how confidently you view its future earnings power and balance sheet scale up.
Successful integration and synergy realization from acquisitions (specifically, the Bremer merger and retention of CRE loans previously planned for sale) is unlocking operational efficiencies and margin expansion, contributing to improved return on equity and tangible book value per share, metrics that may be underappreciated in the current valuation.
Curious what kind of revenue lift, margin shift, and future earnings multiple sit behind that fair value? The projections lean on ambitious growth, richer profitability and a lower earnings multiple than many would expect for a regional bank. Want to see exactly how those assumptions stack up against today’s share price?
Result: Fair Value of $25.75 (UNDERVALUED)
Have a read of the narrative in full and understand what's behind the forecasts.
However, this hinges on ONB managing its sizable commercial real estate exposure and avoiding a sharper slowdown in loan growth as Bremer related run offs continue.
Find out about the key risks to this Old National Bancorp narrative.
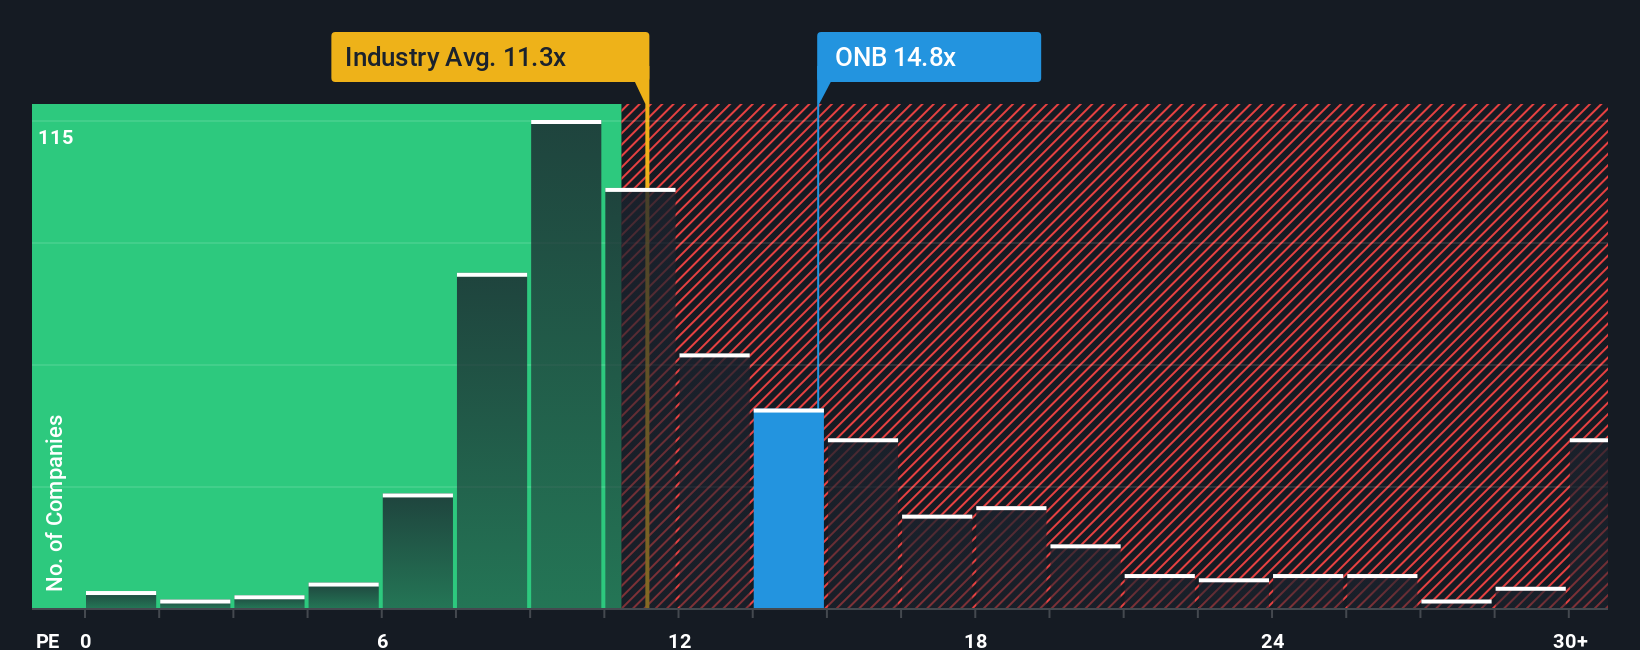
Another View: What The P/E Ratio Is Telling You
The DCF based fair value points to Old National Bancorp trading at a wide discount, but the P/E story is more cautious. ONB sits at 15.2x earnings versus 13.2x for peers and 11.8x for the broader US Banks group, even though its fair ratio is put at 18.6x.
That premium to today’s market multiples, together with a higher fair ratio that the share price could move toward over time, suggests a mix of opportunity and valuation risk rather than a one way bargain. Which signal do you trust more for your own checklist?
See what the numbers say about this price — find out in our valuation breakdown.
Build Your Own Old National Bancorp Narrative
If you see the data differently or just prefer to test your own assumptions, you can spin up a custom view in minutes with Do it your way.
A great starting point for your Old National Bancorp research is our analysis highlighting 4 key rewards and 2 important warning signs that could impact your investment decision.
Looking for more investment ideas?
If Old National has caught your attention, do not stop there. Casting a wider net now can help you spot opportunities before they are crowded.
- Target potential mispricings by scanning these 883 undervalued stocks based on cash flows that may offer appealing cash flow support relative to their current market prices.
- Ride structural shifts in technology by tracking these 25 AI penny stocks linked to artificial intelligence themes that could reshape how businesses operate.
- Boost your income focus by checking out these 14 dividend stocks with yields > 3% that combine higher yields with equity exposure.
This article by Simply Wall St is general in nature. We provide commentary based on historical data and analyst forecasts only using an unbiased methodology and our articles are not intended to be financial advice. It does not constitute a recommendation to buy or sell any stock, and does not take account of your objectives, or your financial situation. We aim to bring you long-term focused analysis driven by fundamental data. Note that our analysis may not factor in the latest price-sensitive company announcements or qualitative material. Simply Wall St has no position in any stocks mentioned.
Have feedback on this article? Concerned about the content? Get in touch with us directly. Alternatively, email editorial-team@simplywallst.com