
- PREMIUM
- LIVE QUOTES
- INSTITUTIONS
 Index Options
 State Street
 CME Group
 Nasdaq
 Cboe
Cboe TradingView
 Wall Street Journal
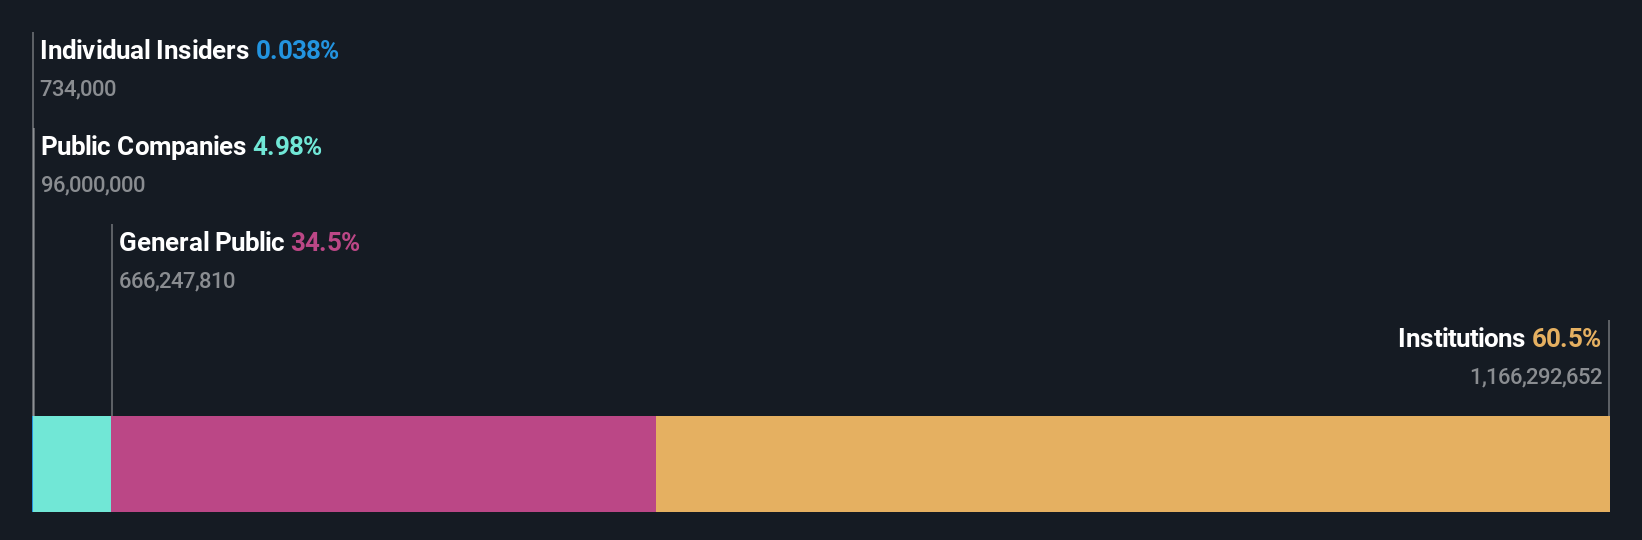
With 60% institutional ownership, Suzuki Motor Corporation (TSE:7269) is a favorite amongst the big guns
Key Insights
- Significantly high institutional ownership implies Suzuki Motor's stock price is sensitive to their trading actions
- The top 16 shareholders own 51% of the company
- Ownership research along with analyst forecasts data help provide a good understanding of opportunities in a stock
Every investor in Suzuki Motor Corporation (TSE:7269) should be aware of the most powerful shareholder groups. And the group that holds the biggest piece of the pie are institutions with 60% ownership. Put another way, the group faces the maximum upside potential (or downside risk).
Because institutional owners have a huge pool of resources and liquidity, their investing decisions tend to carry a great deal of weight, especially with individual investors. Hence, having a considerable amount of institutional money invested in a company is often regarded as a desirable trait.
Let's delve deeper into each type of owner of Suzuki Motor, beginning with the chart below.
View our latest analysis for Suzuki Motor
What Does The Institutional Ownership Tell Us About Suzuki Motor?
Institutional investors commonly compare their own returns to the returns of a commonly followed index. So they generally do consider buying larger companies that are included in the relevant benchmark index.
Suzuki Motor already has institutions on the share registry. Indeed, they own a respectable stake in the company. This implies the analysts working for those institutions have looked at the stock and they like it. But just like anyone else, they could be wrong. It is not uncommon to see a big share price drop if two large institutional investors try to sell out of a stock at the same time. So it is worth checking the past earnings trajectory of Suzuki Motor, (below). Of course, keep in mind that there are other factors to consider, too.

Institutional investors own over 50% of the company, so together than can probably strongly influence board decisions. We note that hedge funds don't have a meaningful investment in Suzuki Motor. The company's largest shareholder is BlackRock, Inc., with ownership of 6.3%. Nomura Asset Management Co., Ltd. is the second largest shareholder owning 5.2% of common stock, and Toyota Motor Corporation holds about 5.0% of the company stock.
Looking at the shareholder registry, we can see that 51% of the ownership is controlled by the top 16 shareholders, meaning that no single shareholder has a majority interest in the ownership.
Researching institutional ownership is a good way to gauge and filter a stock's expected performance. The same can be achieved by studying analyst sentiments. There are a reasonable number of analysts covering the stock, so it might be useful to find out their aggregate view on the future.
Insider Ownership Of Suzuki Motor
The definition of company insiders can be subjective and does vary between jurisdictions. Our data reflects individual insiders, capturing board members at the very least. Company management run the business, but the CEO will answer to the board, even if he or she is a member of it.
Insider ownership is positive when it signals leadership are thinking like the true owners of the company. However, high insider ownership can also give immense power to a small group within the company. This can be negative in some circumstances.
Our information suggests that Suzuki Motor Corporation insiders own under 1% of the company. Being so large, we would not expect insiders to own a large proportion of the stock. Collectively, they own JP¥1.7b of stock. Arguably recent buying and selling is just as important to consider. You can click here to see if insiders have been buying or selling.
General Public Ownership
The general public-- including retail investors -- own 35% stake in the company, and hence can't easily be ignored. While this group can't necessarily call the shots, it can certainly have a real influence on how the company is run.
Public Company Ownership
Public companies currently own 5.0% of Suzuki Motor stock. It's hard to say for sure but this suggests they have entwined business interests. This might be a strategic stake, so it's worth watching this space for changes in ownership.
Next Steps:
It's always worth thinking about the different groups who own shares in a company. But to understand Suzuki Motor better, we need to consider many other factors.
I always like to check for a history of revenue growth. You can too, by accessing this free chart of historic revenue and earnings in this detailed graph.
Ultimately the future is most important. You can access this free report on analyst forecasts for the company.
NB: Figures in this article are calculated using data from the last twelve months, which refer to the 12-month period ending on the last date of the month the financial statement is dated. This may not be consistent with full year annual report figures.
Have feedback on this article? Concerned about the content? Get in touch with us directly. Alternatively, email editorial-team (at) simplywallst.com.
This article by Simply Wall St is general in nature. We provide commentary based on historical data and analyst forecasts only using an unbiased methodology and our articles are not intended to be financial advice. It does not constitute a recommendation to buy or sell any stock, and does not take account of your objectives, or your financial situation. We aim to bring you long-term focused analysis driven by fundamental data. Note that our analysis may not factor in the latest price-sensitive company announcements or qualitative material. Simply Wall St has no position in any stocks mentioned.