
- PREMIUM
- LIVE QUOTES
- INSTITUTIONS
 Index Options
 State Street
 CME Group
 Nasdaq
 Cboe
Cboe TradingView
 Wall Street Journal
Assessing Icahn Enterprises (IEP) Valuation After Recent Choppy Trading And Conflicting P/S And DCF Signals
Why Icahn Enterprises is back on investors’ radar
Icahn Enterprises (IEP) has drawn fresh attention after recent trading left the units around $7.77, prompting investors to reassess its diversified operations, distribution profile and the partnership’s mixed return record over recent years.
See our latest analysis for Icahn Enterprises.
Recent trading has been choppy, with a 1 day share price return of 3.88% and a 7 day share price return of 6.44% contrasting with weaker 90 day share price returns and a 3 year total shareholder return of 72.74% in decline. This points to near term momentum picking up against a longer history of pressure on investor returns.
If Icahn Enterprises has you thinking about where risk and recovery stories might go next, it could be worth scanning fast growing stocks with high insider ownership as a fresh source of ideas.
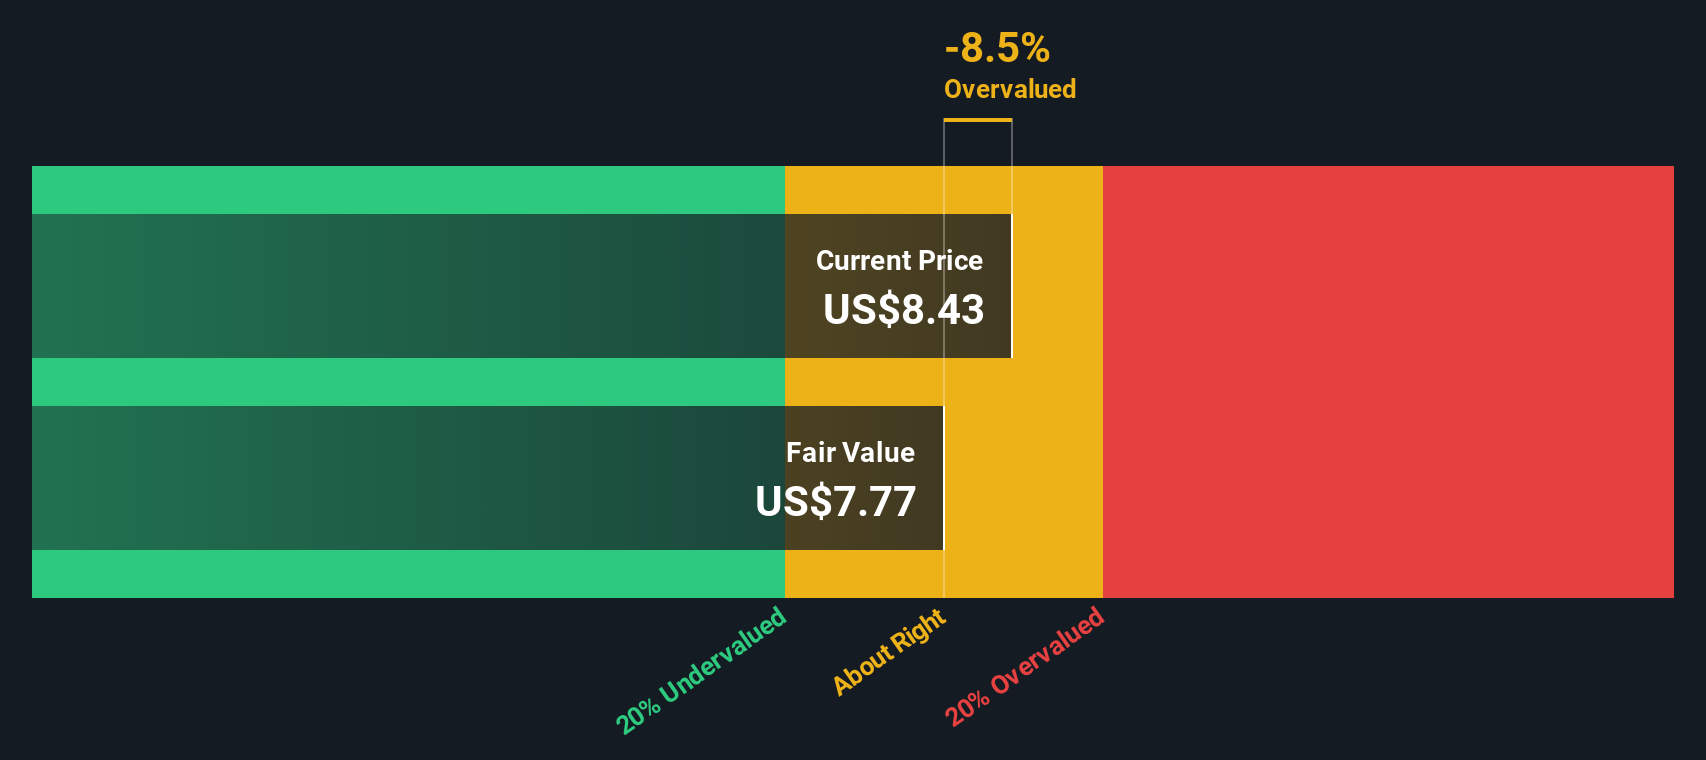
With units around $7.77, Icahn Enterprises trades at a discount to a published $12.00 price target. However, mixed returns and a recent net loss complicate the outlook, leaving investors to decide whether this represents a reset entry point or whether the market is already pricing in future growth.
Price-to-Sales of 0.5x: Is it justified?
At a last close of US$7.77, Icahn Enterprises trades on a P/S of 0.5x, which screens as inexpensive compared to peers and the wider Industrials space.
The P/S ratio compares the company’s market value to its revenue, so a lower figure can indicate the market is assigning a lower value to each dollar of sales. For a diversified partnership like Icahn Enterprises, with exposure to investment, energy, automotive, food packaging, real estate, home fashion and pharma, this can matter more than earnings based metrics when profitability is uneven.
According to the statements, Icahn Enterprises is described as good value on P/S versus both its direct peer group at 1.1x and the global Industrials average at 0.8x. The ratio also sits below an estimated fair P/S of 0.6x, which implies the current multiple is under that level the market could move towards if sentiment or fundamentals shifted in line with that fair ratio estimate.
Explore the SWS fair ratio for Icahn Enterprises
Result: Price-to-Sales of 0.5x (UNDERVALUED)
However, you still have to weigh the recent net loss of US$391 million and a 3-year total return decline of 73% as potential brakes on any recovery story.
Find out about the key risks to this Icahn Enterprises narrative.
Another view: SWS DCF flags a very different picture
While the 0.5x P/S ratio points to Icahn Enterprises looking inexpensive, our DCF model paints a contrasting view. On that measure, the units at US$7.77 are trading well above an estimated fair value of US$0.15, which suggests a very rich price relative to modelled cash flows. For you, the question is which signal you trust more: the sales based multiple or the cash flow model.
Look into how the SWS DCF model arrives at its fair value.
Simply Wall St performs a discounted cash flow (DCF) on every stock in the world every day (check out Icahn Enterprises for example). We show the entire calculation in full. You can track the result in your watchlist or portfolio and be alerted when this changes, or use our stock screener to discover 880 undervalued stocks based on their cash flows. If you save a screener we even alert you when new companies match - so you never miss a potential opportunity.
Build Your Own Icahn Enterprises Narrative
If you see the numbers differently or prefer to work through the data yourself, you can build and publish your own view in minutes by starting with Do it your way.
A great starting point for your Icahn Enterprises research is our analysis highlighting 3 key rewards and 2 important warning signs that could impact your investment decision.
Looking for more investment ideas?
Before you move on, give yourself the best shot at finding stronger ideas by scanning pre filtered stock sets that line up with different investing angles and income goals.
- Target potential mispricing by reviewing these 880 undervalued stocks based on cash flows that may offer more appealing entry points based on their cash flow profiles.
- Tap into the growth story of machine learning and automation by checking out these 25 AI penny stocks that are tied to real business use cases.
- Build a steadier income stream by focusing on these 14 dividend stocks with yields > 3% that already meet a minimum yield hurdle of more than 3%.
This article by Simply Wall St is general in nature. We provide commentary based on historical data and analyst forecasts only using an unbiased methodology and our articles are not intended to be financial advice. It does not constitute a recommendation to buy or sell any stock, and does not take account of your objectives, or your financial situation. We aim to bring you long-term focused analysis driven by fundamental data. Note that our analysis may not factor in the latest price-sensitive company announcements or qualitative material. Simply Wall St has no position in any stocks mentioned.
Have feedback on this article? Concerned about the content? Get in touch with us directly. Alternatively, email editorial-team@simplywallst.com