
- PREMIUM
- LIVE QUOTES
- INSTITUTIONS
 Index Options
 State Street
 CME Group
 Nasdaq
 Cboe
Cboe TradingView
 Wall Street Journal
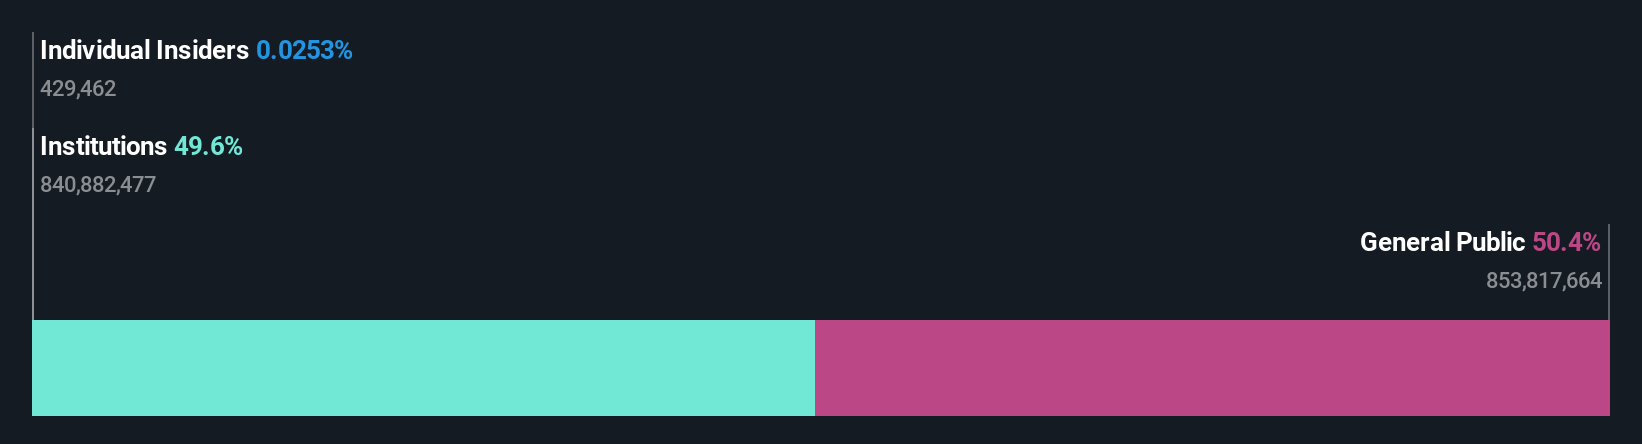
Auckland International Airport Limited's (NZSE:AIA) top owners are individual investors with 50% stake, while 50% is held by institutions
Key Insights
- Auckland International Airport's significant individual investors ownership suggests that the key decisions are influenced by shareholders from the larger public
- The top 25 shareholders own 46% of the company
- 50% of Auckland International Airport is held by Institutions
To get a sense of who is truly in control of Auckland International Airport Limited (NZSE:AIA), it is important to understand the ownership structure of the business. We can see that individual investors own the lion's share in the company with 50% ownership. That is, the group stands to benefit the most if the stock rises (or lose the most if there is a downturn).
And institutions on the other hand have a 50% ownership in the company. Large companies usually have institutions as shareholders, and we usually see insiders owning shares in smaller companies.
In the chart below, we zoom in on the different ownership groups of Auckland International Airport.
View our latest analysis for Auckland International Airport
What Does The Institutional Ownership Tell Us About Auckland International Airport?
Many institutions measure their performance against an index that approximates the local market. So they usually pay more attention to companies that are included in major indices.
Auckland International Airport already has institutions on the share registry. Indeed, they own a respectable stake in the company. This implies the analysts working for those institutions have looked at the stock and they like it. But just like anyone else, they could be wrong. When multiple institutions own a stock, there's always a risk that they are in a 'crowded trade'. When such a trade goes wrong, multiple parties may compete to sell stock fast. This risk is higher in a company without a history of growth. You can see Auckland International Airport's historic earnings and revenue below, but keep in mind there's always more to the story.

We note that hedge funds don't have a meaningful investment in Auckland International Airport. BlackRock, Inc. is currently the company's largest shareholder with 10% of shares outstanding. Australian Super Pty Ltd is the second largest shareholder owning 8.6% of common stock, and JPMorgan Chase & Co. holds about 7.9% of the company stock.
On studying our ownership data, we found that 25 of the top shareholders collectively own less than 50% of the share register, implying that no single individual has a majority interest.
While studying institutional ownership for a company can add value to your research, it is also a good practice to research analyst recommendations to get a deeper understand of a stock's expected performance. Quite a few analysts cover the stock, so you could look into forecast growth quite easily.
Insider Ownership Of Auckland International Airport
While the precise definition of an insider can be subjective, almost everyone considers board members to be insiders. The company management answer to the board and the latter should represent the interests of shareholders. Notably, sometimes top-level managers are on the board themselves.
Insider ownership is positive when it signals leadership are thinking like the true owners of the company. However, high insider ownership can also give immense power to a small group within the company. This can be negative in some circumstances.
Our information suggests that Auckland International Airport Limited insiders own under 1% of the company. It is a very large company, so it would be surprising to see insiders own a large proportion of the company. Though their holding amounts to less than 1%, we can see that board members collectively own NZ$3.7m worth of shares (at current prices). In this sort of situation, it can be more interesting to see if those insiders have been buying or selling.
General Public Ownership
The general public -- including retail investors -- own 50% of Auckland International Airport. This level of ownership gives investors from the wider public some power to sway key policy decisions such as board composition, executive compensation, and the dividend payout ratio.
Next Steps:
I find it very interesting to look at who exactly owns a company. But to truly gain insight, we need to consider other information, too. Consider for instance, the ever-present spectre of investment risk. We've identified 1 warning sign with Auckland International Airport , and understanding them should be part of your investment process.
If you are like me, you may want to think about whether this company will grow or shrink. Luckily, you can check this free report showing analyst forecasts for its future.
NB: Figures in this article are calculated using data from the last twelve months, which refer to the 12-month period ending on the last date of the month the financial statement is dated. This may not be consistent with full year annual report figures.
Have feedback on this article? Concerned about the content? Get in touch with us directly. Alternatively, email editorial-team (at) simplywallst.com.
This article by Simply Wall St is general in nature. We provide commentary based on historical data and analyst forecasts only using an unbiased methodology and our articles are not intended to be financial advice. It does not constitute a recommendation to buy or sell any stock, and does not take account of your objectives, or your financial situation. We aim to bring you long-term focused analysis driven by fundamental data. Note that our analysis may not factor in the latest price-sensitive company announcements or qualitative material. Simply Wall St has no position in any stocks mentioned.