
- PREMIUM
- LIVE QUOTES
- INSTITUTIONS
 Index Options
 State Street
 CME Group
 Nasdaq
 Cboe
Cboe TradingView
 Wall Street Journal
Assessing Skeena Resources (TSX:SKE) Valuation After Eskay Creek Technical And Permitting Updates
What triggered the latest move in Skeena Resources?
Skeena Resources (TSX:SKE) has been in focus after new technical and permitting updates on its Eskay Creek gold silver project, which have clarified some aspects of project economics and development timelines.
See our latest analysis for Skeena Resources.
Those Eskay Creek updates come after a strong run, with the share price at CA$33.50 and a 90 day share price return of 27.67%. The 1 year total shareholder return of 144.53% and 3 year total shareholder return of about 2.7x highlight how sentiment around funding, permitting and project execution has been shifting over a longer horizon.
If you are looking beyond a single project story, this could be a good moment to broaden your search and check out fast growing stocks with high insider ownership.
With Skeena up 144.53% over the past year and trading at CA$33.50, yet still below an average analyst price target of CA$36.40, you have to ask: is there real value left here, or is the market already pricing in future growth?
Price to book of 47.6x, is it justified?
At a last close of CA$33.50, Skeena Resources is trading on a P/B ratio of 47.6x, which is far richer than both its peer group and the wider Canadian metals and mining industry.
P/B compares a company’s market value with the book value of its equity, so for a pre revenue, loss making explorer like Skeena it effectively reflects what investors are willing to pay today relative to its current net assets.
According to the Simply Wall St statements, Skeena’s 47.6x P/B ratio sits against a peer average of 4.6x and an industry average of 3x. This is a very wide gap, and indicates that the market is attaching a far higher value to Skeena’s balance sheet than to most comparable miners.
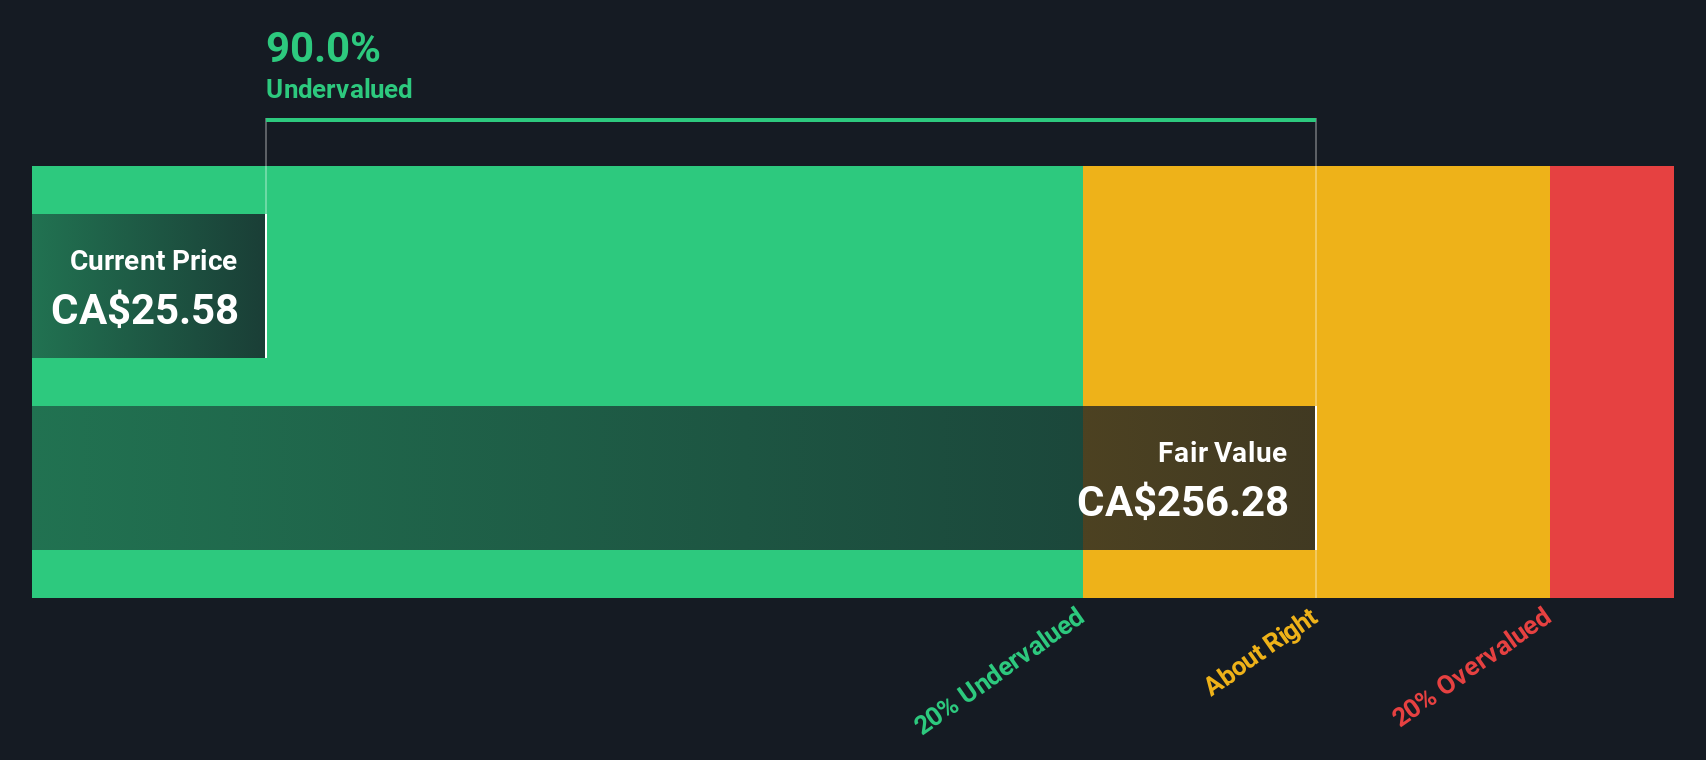
With the shares also flagged as trading at 88.6% below the SWS DCF fair value estimate of CA$294.91, there is a clear tension between what a simple asset based multiple suggests and what the cash flow based model implies about long term potential. See what the numbers say about this price — find out in our valuation breakdown.
Result: Price to book ratio of 47.6x (OVERVALUED)
However, you are still relying heavily on successful permitting and funding for Eskay Creek. Any delay or cost pressure could quickly challenge today’s rich P/B.
Find out about the key risks to this Skeena Resources narrative.
Another way to look at Skeena’s value
While the 47.6x P/B ratio makes Skeena look very expensive next to peers at 4.6x and the Canadian metals and mining industry at 3x, the SWS DCF model points the other way, with a fair value estimate of CA$294.91 versus today’s CA$33.50. That is a very large gap, so which signal do you trust more for a project stage explorer?
Look into how the SWS DCF model arrives at its fair value.
Simply Wall St performs a discounted cash flow (DCF) on every stock in the world every day (check out Skeena Resources for example). We show the entire calculation in full. You can track the result in your watchlist or portfolio and be alerted when this changes, or use our stock screener to discover 880 undervalued stocks based on their cash flows. If you save a screener we even alert you when new companies match - so you never miss a potential opportunity.
Build Your Own Skeena Resources Narrative
If you look at the numbers and come to a different conclusion, or prefer to work from your own assumptions, you can build a personalized Skeena view in a few minutes with Do it your way.
A great starting point for your Skeena Resources research is our analysis highlighting 2 key rewards and 2 important warning signs that could impact your investment decision.
Looking for more investment ideas?
If Skeena has your attention, do not stop here, broaden your watchlist with a few focused stock ideas that match how you like to invest.
- Target income potential by scanning these 14 dividend stocks with yields > 3% that can help anchor your portfolio with regular cash returns.
- Chase early stage growth by reviewing these 3557 penny stocks with strong financials that already show stronger fundamentals than many micro caps.
- Focus on value by checking these 880 undervalued stocks based on cash flows that screen for companies trading below what their cash flows may justify.
This article by Simply Wall St is general in nature. We provide commentary based on historical data and analyst forecasts only using an unbiased methodology and our articles are not intended to be financial advice. It does not constitute a recommendation to buy or sell any stock, and does not take account of your objectives, or your financial situation. We aim to bring you long-term focused analysis driven by fundamental data. Note that our analysis may not factor in the latest price-sensitive company announcements or qualitative material. Simply Wall St has no position in any stocks mentioned.
Have feedback on this article? Concerned about the content? Get in touch with us directly. Alternatively, email editorial-team@simplywallst.com