
- PREMIUM
- LIVE QUOTES
- INSTITUTIONS
 Index Options
 State Street
 CME Group
 Nasdaq
 Cboe
Cboe TradingView
 Wall Street Journal
Is PayPal (PYPL) Pricing In Too Much Pessimism After Multi Year Share Price Slump
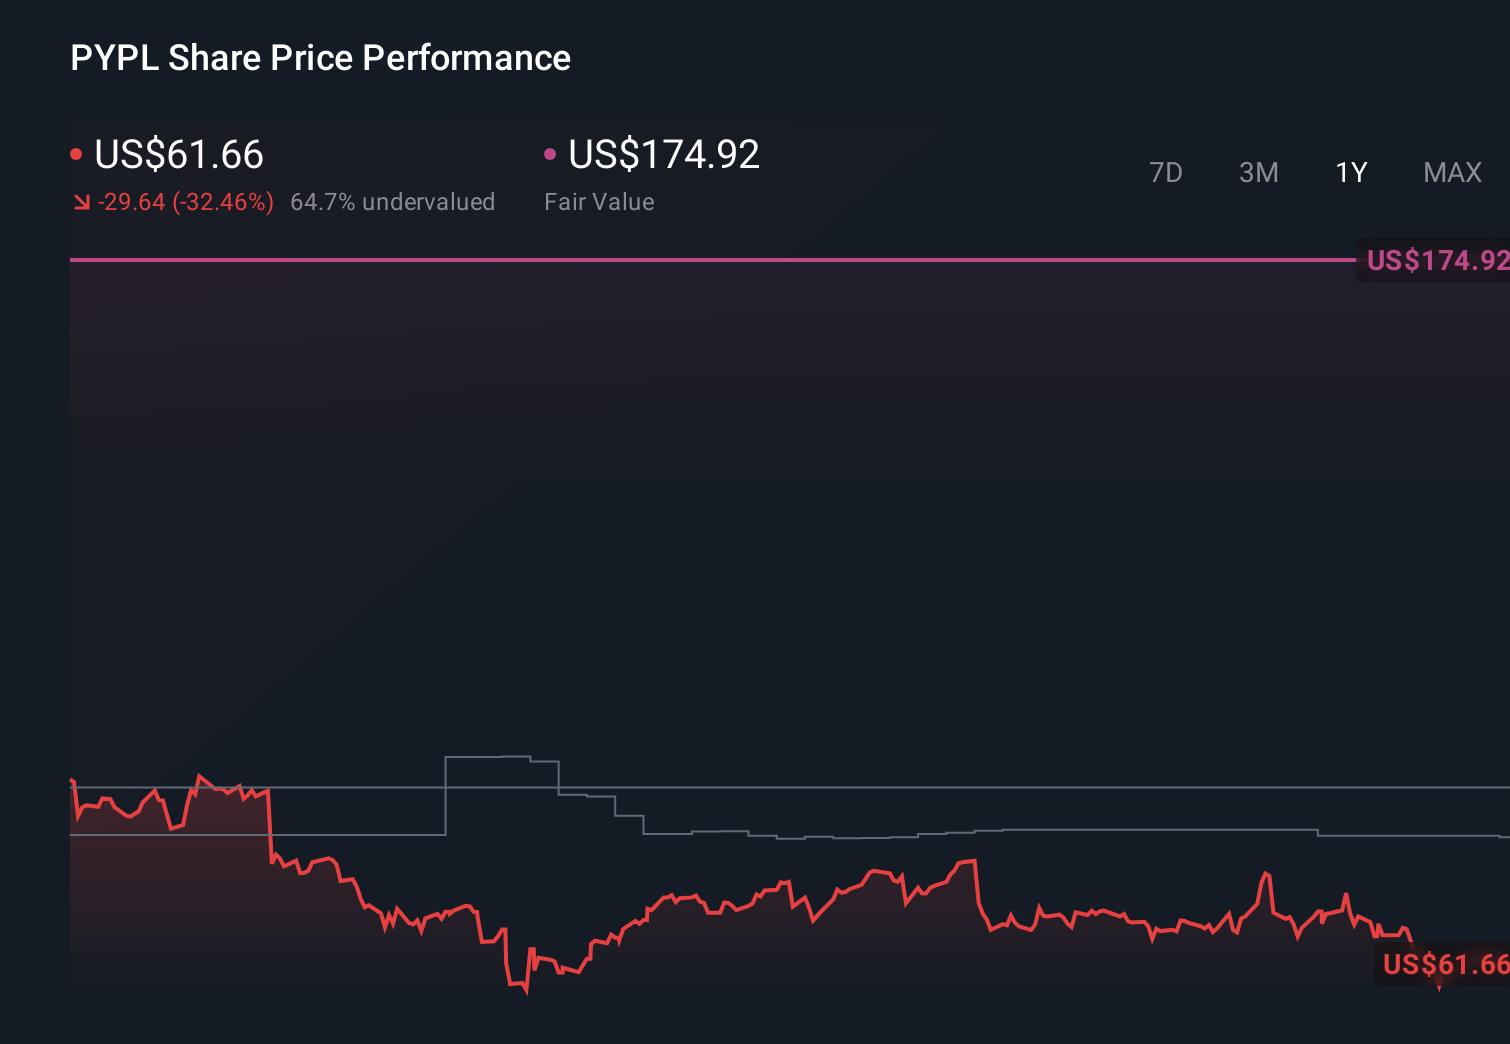
- If you are wondering whether PayPal Holdings at around US$59.29 is pricing in too much pessimism or quiet potential, you are not alone.
- The stock is roughly flat over the last week at a 0.3% gain, slightly lower over the past month with a 4.8% decline, modestly higher year to date at 2.0%, yet still 32.4% lower over 1 year and 75.0% lower over 5 years. This raises fair questions about how the current price lines up with its fundamentals.
- Recent headlines have continued to focus on PayPal's position in global digital payments and how it is responding to competition and changing user habits. This backdrop provides important context for those mixed return figures, as the market weighs the company’s role in online and mobile transactions.
- On our valuation checks, PayPal scores 5 out of 6, giving it a valuation score of 5/6. Next we will look at what different valuation approaches say about that number, before finishing with a way of thinking about value that goes beyond any single model.
Find out why PayPal Holdings's -32.4% return over the last year is lagging behind its peers.
Approach 1: PayPal Holdings Excess Returns Analysis
The Excess Returns model looks at how much profit a company is expected to generate above the return that shareholders require, and then capitalizes those “extra” profits into a per share value.
For PayPal Holdings, the starting Book Value is $21.46 per share and the Stable EPS used in the model is $6.53 per share, based on weighted future Return on Equity estimates from 9 analysts. The implied Cost of Equity is $2.09 per share, which leaves an Excess Return of $4.44 per share. That excess is effectively the gap between what shareholders are assumed to require and what the business is expected to earn on its equity base.
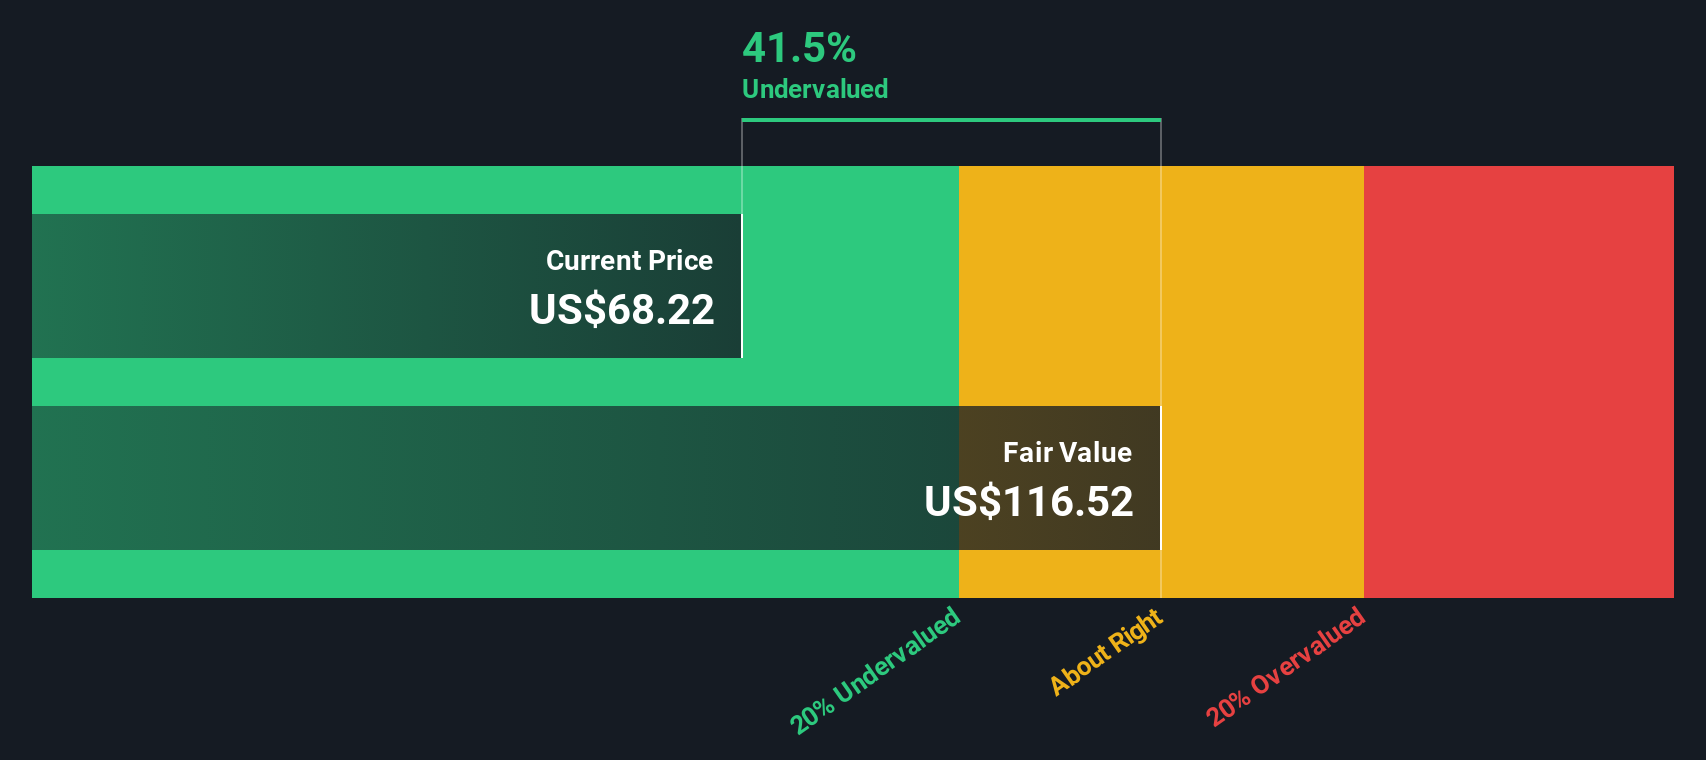
The model also uses a Stable Book Value of $26.92 per share, sourced from weighted future Book Value estimates from 8 analysts, together with an average Return on Equity of 24.27%. Combining these inputs, the Excess Returns approach produces an estimated intrinsic value of about $125.06 per share. Compared to a recent share price around $59.29, this implies the stock is 52.6% undervalued on this framework.
Result: UNDERVALUED
Our Excess Returns analysis suggests PayPal Holdings is undervalued by 52.6%. Track this in your watchlist or portfolio, or discover 880 more undervalued stocks based on cash flows.
Approach 2: PayPal Holdings Price vs Earnings
For a profitable company like PayPal, the P/E ratio is a useful yardstick because it links what you pay for each share to the earnings that share currently generates. Investors usually accept a higher P/E when they expect stronger earnings growth or see lower risk, and a lower P/E when growth expectations are more muted or risks are higher.
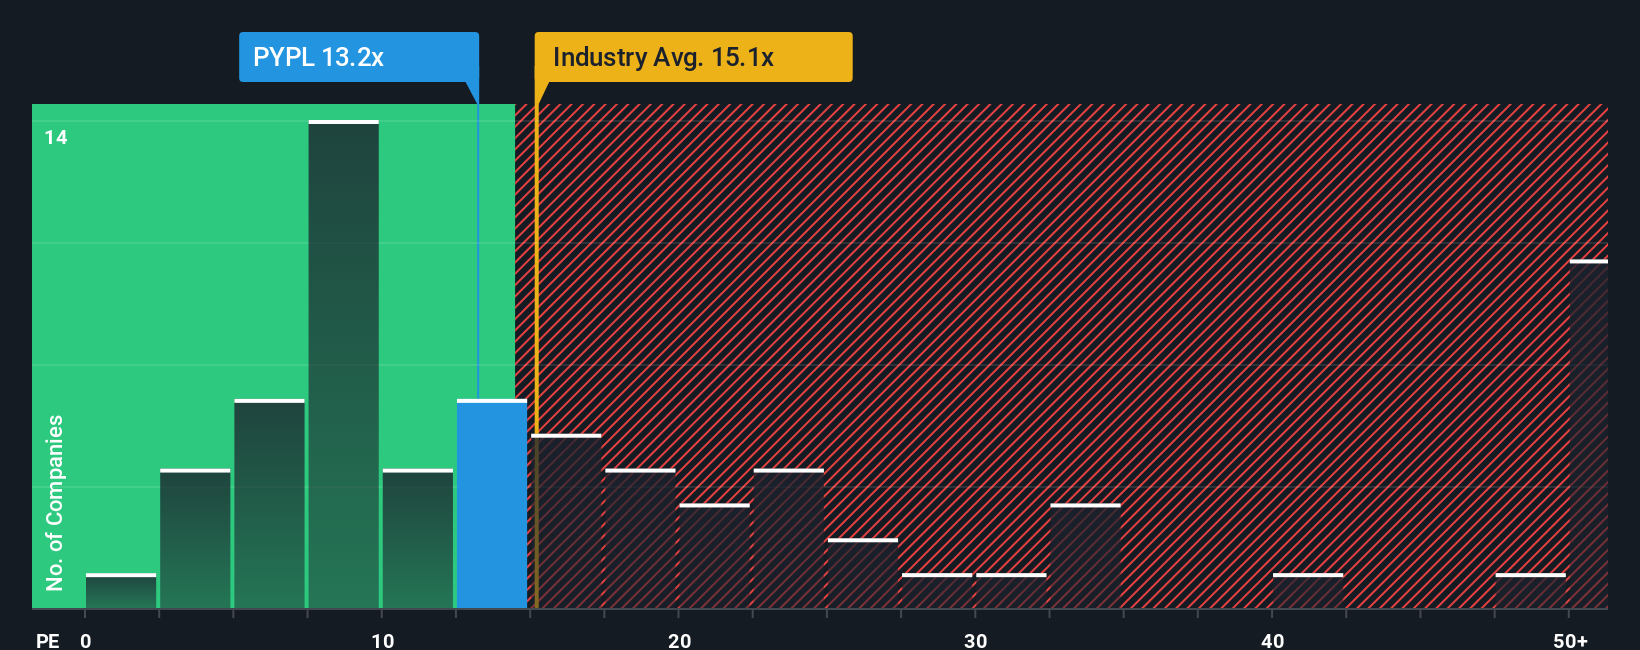
PayPal currently trades on a P/E of 11.28x. That sits below the Diversified Financial industry average of 13.99x and well below the peer group average of 59.44x. Simply Wall St’s Fair Ratio model, which estimates what a more tailored P/E might look like for PayPal, arrives at 18.10x. This Fair Ratio incorporates factors such as earnings growth estimates, profit margins, the company’s industry and market cap, as well as stock specific risks, so it aims to be more targeted than a simple comparison with broad industry or peer averages.
Comparing the current P/E of 11.28x with the Fair Ratio of 18.10x suggests the market is pricing PayPal below what this framework would imply.
Result: UNDERVALUED
P/E ratios tell one story, but what if the real opportunity lies elsewhere? Discover 1454 companies where insiders are betting big on explosive growth.
Upgrade Your Decision Making: Choose your PayPal Holdings Narrative
Earlier we mentioned that there is an even better way to understand valuation. Let us introduce you to Narratives, which let you attach a clear story about PayPal Holdings to the numbers you care about, such as your own fair value, revenue, earnings and margin assumptions. You can then link that story to a forecast and a fair value you can compare with the current price.
On Simply Wall St’s Community page, Narratives are an easy tool you can use to set out your view on PayPal in plain language, connect it to a financial forecast, and see how your implied fair value compares with today’s share price. This can help you assess whether the gap between price and value is wide enough for you to consider a trade.
Because Narratives update when new information arrives, such as earnings or major news, your view does not stay static. You can also see how other investors’ Narratives differ. For example, one Narrative on PayPal currently points to a fair value of about US$189.96 per share, while another points to about US$81.99, showing how the same company can lead to very different conclusions once you change the story and the inputs behind it.
Do you think there's more to the story for PayPal Holdings? Head over to our Community to see what others are saying!
This article by Simply Wall St is general in nature. We provide commentary based on historical data and analyst forecasts only using an unbiased methodology and our articles are not intended to be financial advice. It does not constitute a recommendation to buy or sell any stock, and does not take account of your objectives, or your financial situation. We aim to bring you long-term focused analysis driven by fundamental data. Note that our analysis may not factor in the latest price-sensitive company announcements or qualitative material. Simply Wall St has no position in any stocks mentioned.
Have feedback on this article? Concerned about the content? Get in touch with us directly. Alternatively, email editorial-team@simplywallst.com