
- PREMIUM
- LIVE QUOTES
- INSTITUTIONS
 Index Options
 State Street
 CME Group
 Nasdaq
 Cboe
Cboe TradingView
 Wall Street Journal
Is Conagra Brands (CAG) Pricing Power Concerns Creating A Long Term Opportunity For Investors
- If you are wondering whether Conagra Brands' current share price reflects fair value or a potential mispricing, this article is designed to walk you through that question step by step.
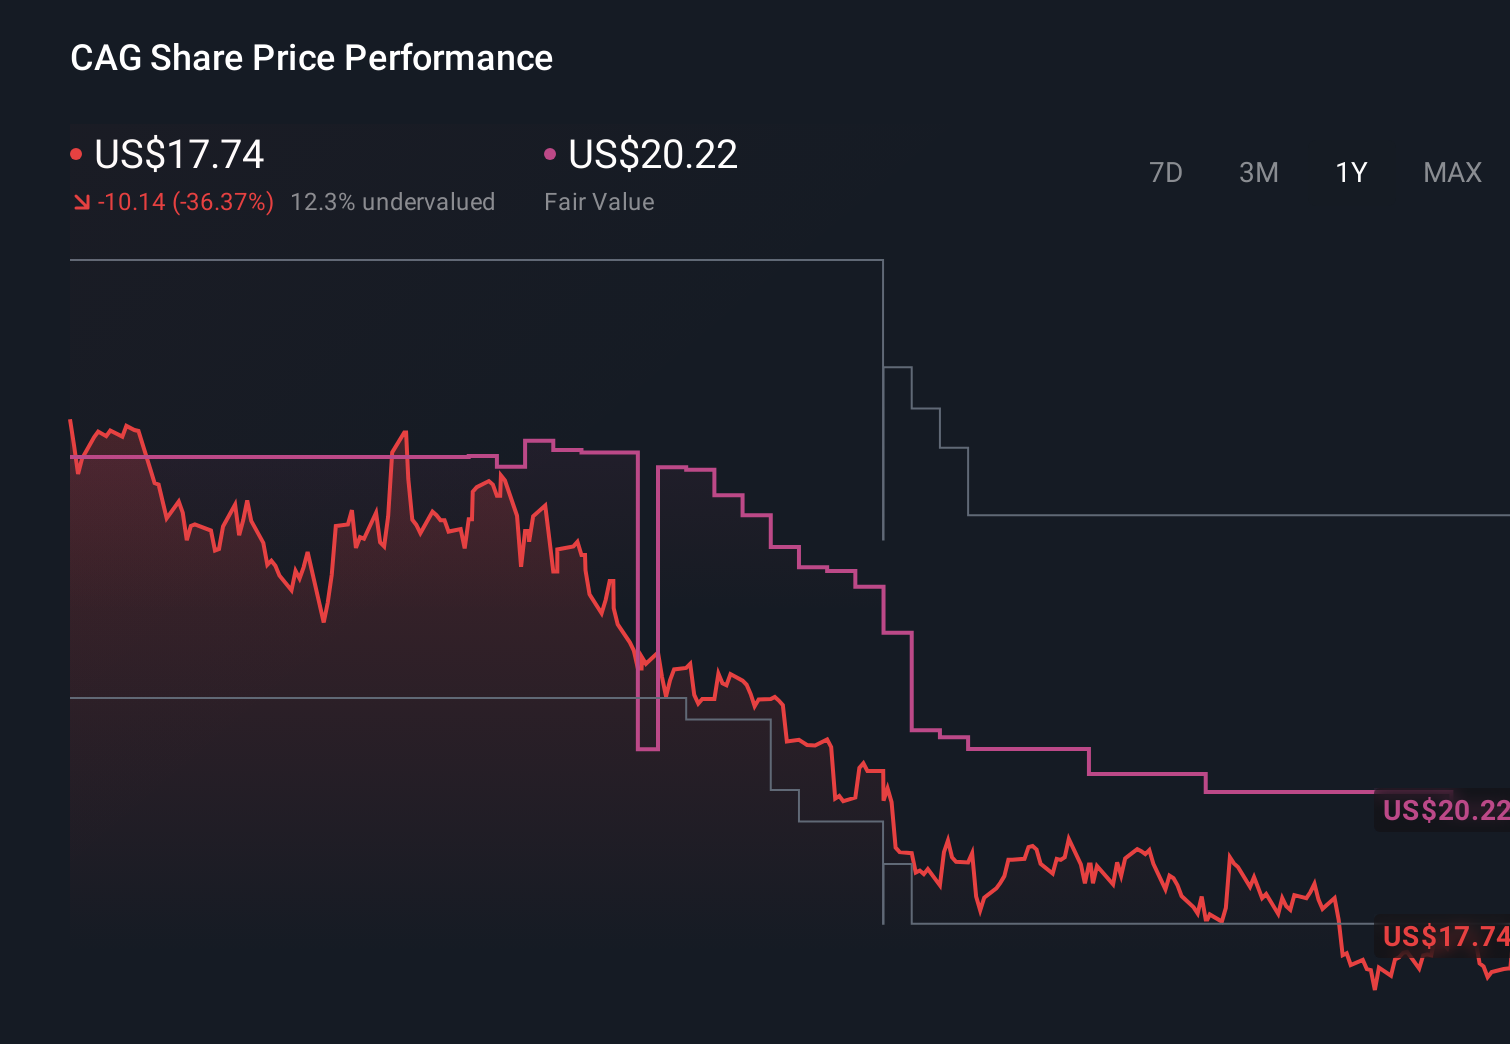
- Conagra Brands' stock last closed at US$17.08, with returns of a 2.0% decline over 7 days, 0.2% over 30 days, a 1.3% decline year to date, a 31.4% decline over 1 year, and a 50.7% decline over 3 years, alongside a 35.0% decline over 5 years.
- Recent coverage of Conagra Brands has focused on how investors are reassessing consumer packaged food companies and their pricing power, as well as how branded food makers are competing for shelf space. This context helps frame why the stock's performance has been under close watch and why valuation has become a key talking point.
- On our checks, Conagra Brands has a valuation score of 4 out of 6. Next, we will compare what that means across different valuation methods before finishing with a way to think about value that goes beyond the usual models.
Find out why Conagra Brands's -31.4% return over the last year is lagging behind its peers.
Approach 1: Conagra Brands Discounted Cash Flow (DCF) Analysis
A Discounted Cash Flow, or DCF, model estimates what a business could be worth today by projecting its future cash flows and then discounting those back to a present value.
For Conagra Brands, the model used is a 2 Stage Free Cash Flow to Equity approach based on cash flow projections. The company’s last twelve months Free Cash Flow is about $897.1 million. Analyst and extrapolated estimates suggest Free Cash Flow of $758.8 million in 2026, rising through the forecast period to $1,960.2 million in 2035, with figures between those years a mix of analyst inputs and Simply Wall St extrapolations.
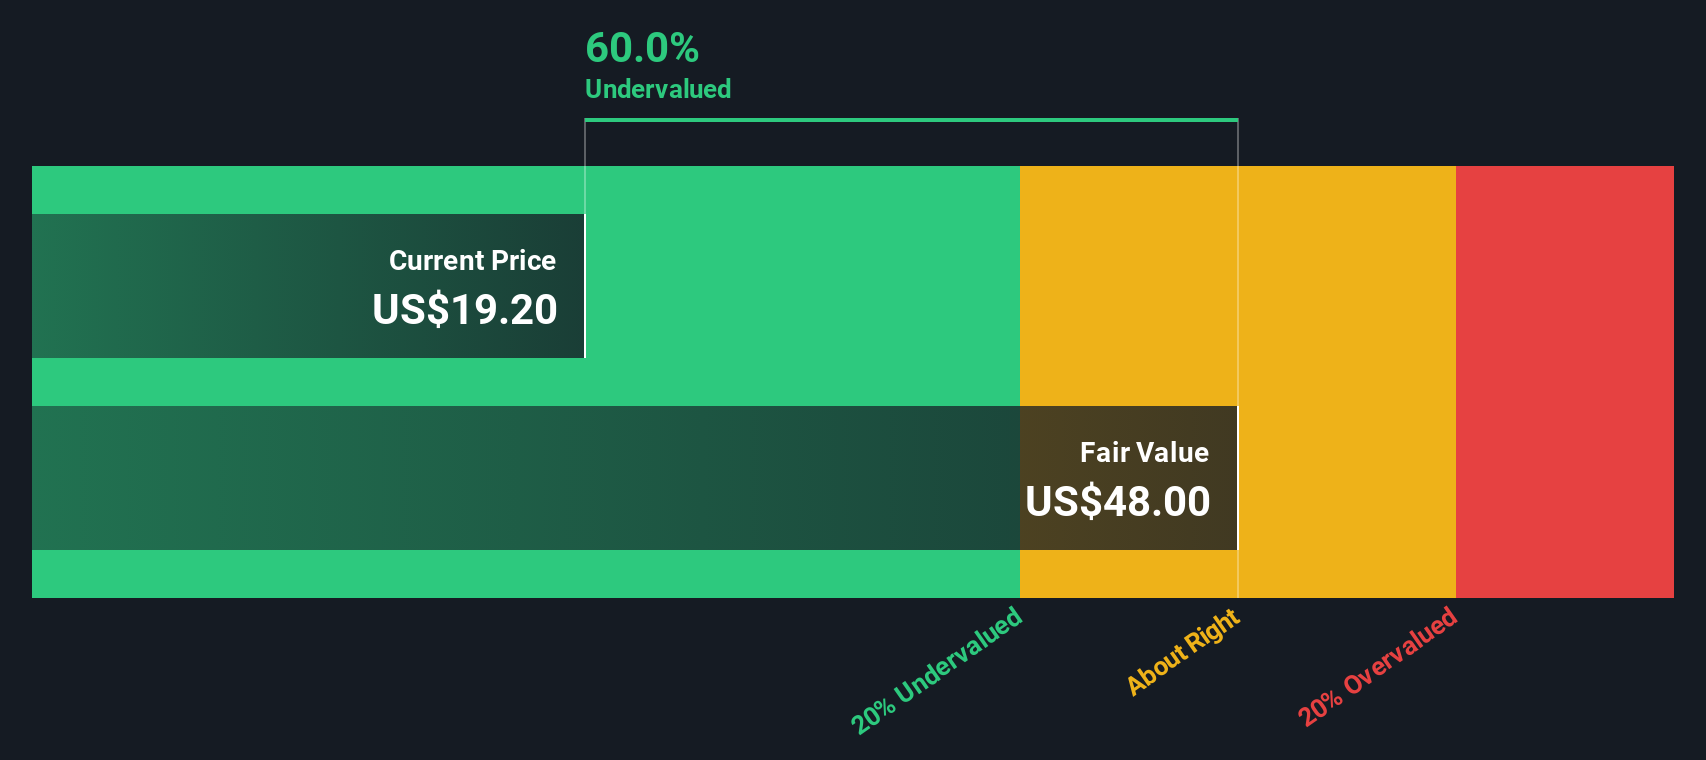
When those projected cash flows are discounted back to today using this DCF model, the estimated intrinsic value comes out at roughly US$75.08 per share. At the recent share price of US$17.08, the model implies the stock is about 77.3% undervalued based on these assumptions.
Result: UNDERVALUED
Our Discounted Cash Flow (DCF) analysis suggests Conagra Brands is undervalued by 77.3%. Track this in your watchlist or portfolio, or discover 878 more undervalued stocks based on cash flows.
Approach 2: Conagra Brands Price vs Sales
For companies that generate meaningful revenue but may have volatile or low earnings, the P/S ratio is often a useful way to think about value because it focuses on what investors are paying for each dollar of sales rather than profit.
In general, higher growth expectations and lower perceived risk can support a higher “normal” or “fair” P/S multiple, while slower growth or higher risk tends to justify a lower multiple. That context helps when you compare Conagra Brands to its peers.
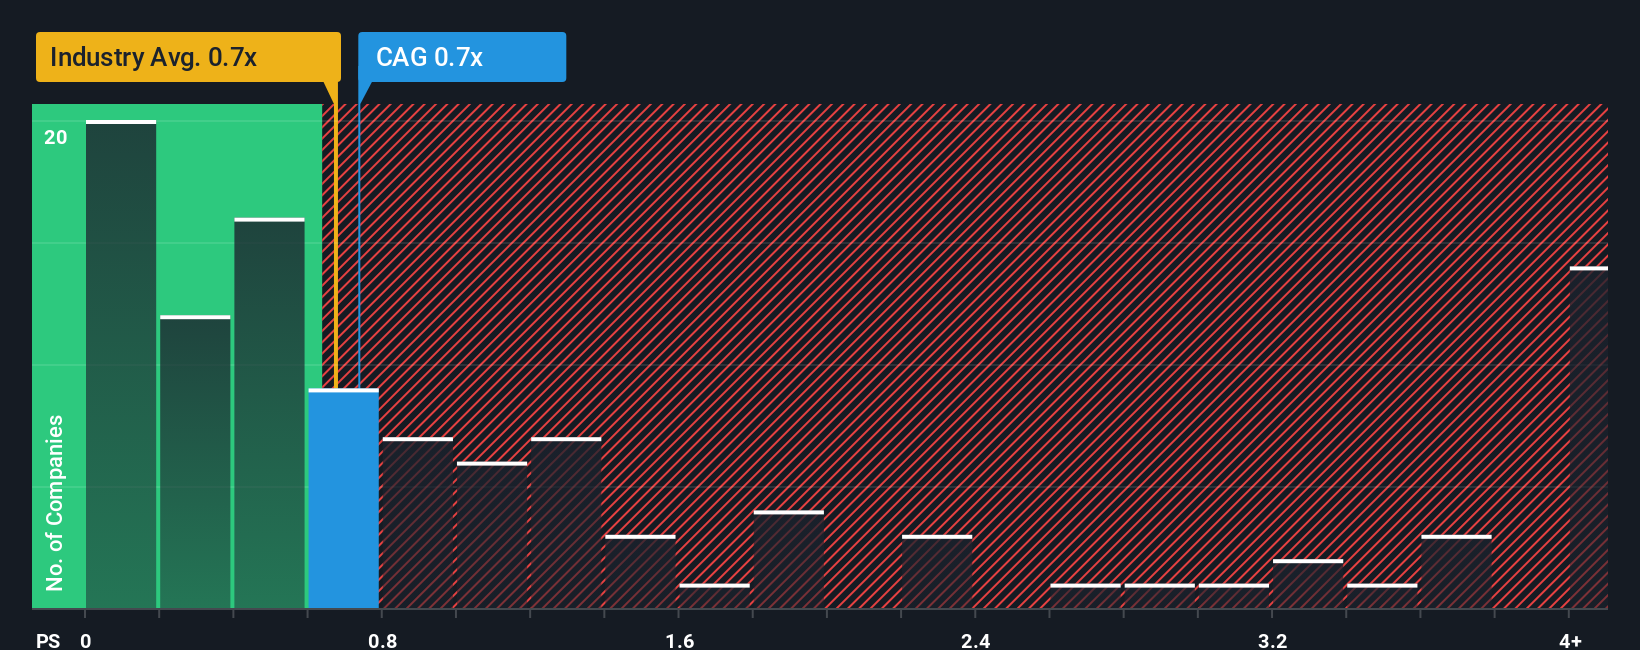
Conagra Brands currently trades on a P/S ratio of 0.73x. This sits close to the Food industry average of 0.62x and also near the peer group average of 0.75x. Simply Wall St’s Fair Ratio model, which estimates what a company’s P/S “should” be after accounting for factors like earnings growth, profit margins, industry, market cap and risk, suggests a Fair Ratio of 0.81x for Conagra Brands.
Because the Fair Ratio is slightly above the current 0.73x P/S, the model points to the stock being somewhat undervalued on this measure.
Result: UNDERVALUED
P/S ratios tell one story, but what if the real opportunity lies elsewhere? Discover 1456 companies where insiders are betting big on explosive growth.
Upgrade Your Decision Making: Choose your Conagra Brands Narrative
Earlier we mentioned that there is an even better way to understand valuation. Narratives on Simply Wall St let you turn your view of Conagra Brands into a simple story that connects your assumptions about future revenue, earnings and margins to a forecast and then to a fair value. They show you in one place whether that fair value suggests you might want to buy or sell compared to the current price, update automatically when fresh news or earnings arrive, and make it easy to see how different investors can reasonably disagree. For example, one Narrative may lean toward the higher US$26.00 analyst price target and another may sit closer to the lower US$18.00 view. All of these are available for you to explore on the Community page used by millions of other investors.
Do you think there's more to the story for Conagra Brands? Head over to our Community to see what others are saying!
This article by Simply Wall St is general in nature. We provide commentary based on historical data and analyst forecasts only using an unbiased methodology and our articles are not intended to be financial advice. It does not constitute a recommendation to buy or sell any stock, and does not take account of your objectives, or your financial situation. We aim to bring you long-term focused analysis driven by fundamental data. Note that our analysis may not factor in the latest price-sensitive company announcements or qualitative material. Simply Wall St has no position in any stocks mentioned.
Have feedback on this article? Concerned about the content? Get in touch with us directly. Alternatively, email editorial-team@simplywallst.com