
- PREMIUM
- LIVE QUOTES
- INSTITUTIONS
 Index Options
 State Street
 CME Group
 Nasdaq
 Cboe
Cboe TradingView
 Wall Street Journal
Is There An Opportunity In CONMED (CNMD) After A 38% One Year Share Price Fall
- If you are wondering whether CONMED's current share price reflects its true worth, you are not alone. This article is here to unpack what that might look like using several valuation tools.
- Recently, the stock closed at US$41.88, with returns of 1.8% over 7 days, 4.5% over 30 days, 3.4% year to date, and a 38.2% decline over 1 year, alongside longer term declines of 54.9% over 3 years and 62.6% over 5 years.
- These moves have put valuation firmly in focus for many investors, who are weighing up whether the current level reflects overly cautious sentiment or something more fundamental. This is why it is useful to step back from short term price swings and assess the business using consistent, transparent valuation checks.
- On Simply Wall St's 6 point valuation checklist, CONMED scores 5 out of 6. We will walk through what that means using methods like discounted cash flow, multiples and peer comparisons, before finishing with a way to look at valuation that can give you a broader context than any single model alone.
Find out why CONMED's -38.2% return over the last year is lagging behind its peers.
Approach 1: CONMED Discounted Cash Flow (DCF) Analysis
A Discounted Cash Flow, or DCF, model estimates what a business might be worth today by projecting its future cash flows and then discounting those back into a single present value figure.
For CONMED, Simply Wall St uses a 2 Stage Free Cash Flow to Equity model built on cash flow projections. The latest twelve month Free Cash Flow is about US$149.1 million, and analyst or modelled projections run out over the next decade, with forecast Free Cash Flow of around US$168.6 million in 2035. Analyst inputs are used where available, and later years are extrapolated by Simply Wall St using its own assumptions.
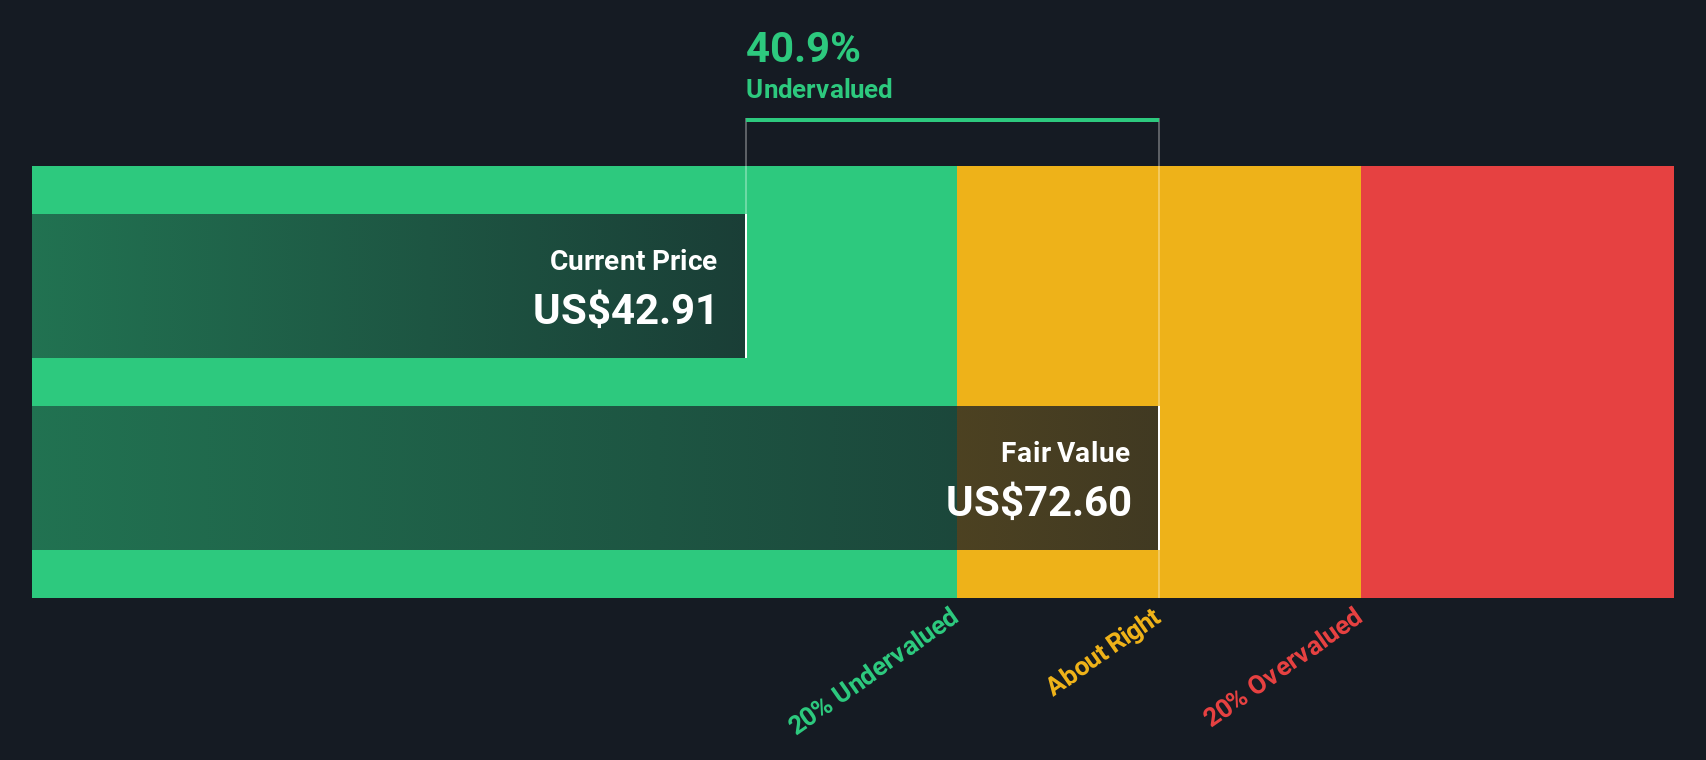
Pulling these cash flows together, the model arrives at an estimated intrinsic value of US$72.45 per share. Compared with the recent share price of US$41.88, this implies the stock is about 42.2% below that DCF estimate. On this metric, CONMED appears to be trading at a sizable discount.
Result: UNDERVALUED
Our Discounted Cash Flow (DCF) analysis suggests CONMED is undervalued by 42.2%. Track this in your watchlist or portfolio, or discover 878 more undervalued stocks based on cash flows.
Approach 2: CONMED Price vs Earnings (P/E)
P/E is a useful yardstick for profitable companies because it compares what you pay for each share with the earnings that business is currently generating. It lets you see how much the market is willing to pay for each US$1 of earnings.
What counts as a normal or fair P/E usually reflects how the market views a company’s growth potential and risk. Higher expected growth or lower perceived risk can support a higher P/E, while slower growth or higher risk often lines up with a lower P/E.
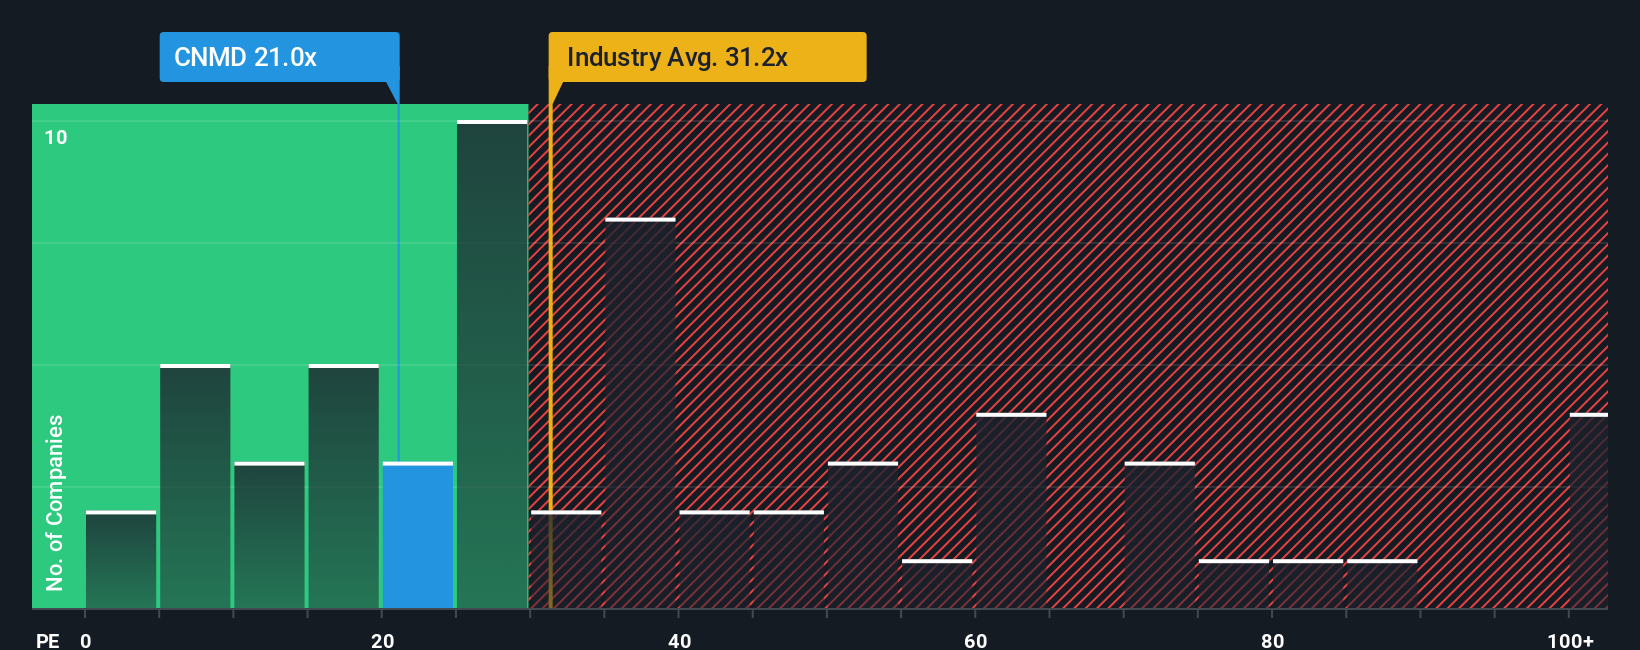
CONMED currently trades on a P/E of 20.24x. That sits below the Medical Equipment industry average of 29.91x and the peer average of 34.33x. Simply Wall St also calculates a proprietary “Fair Ratio” of 24.27x for CONMED. This is the P/E level it might trade on given factors such as its earnings growth profile, profit margins, industry, market cap and specific risks.
This Fair Ratio is more tailored than a simple comparison with peers or the broad industry because it folds in those company specific features rather than relying only on averages. With CONMED’s actual P/E of 20.24x below the Fair Ratio of 24.27x, the shares screen as undervalued on this metric.
Result: UNDERVALUED
P/E ratios tell one story, but what if the real opportunity lies elsewhere? Discover 1457 companies where insiders are betting big on explosive growth.
Upgrade Your Decision Making: Choose your CONMED Narrative
Earlier we mentioned that there is an even better way to understand valuation. Narratives on Simply Wall St let you attach a clear story about CONMED to the numbers you care about by linking your view of its future revenue, earnings and margins to a financial forecast, an implied fair value, and then a simple comparison of that fair value to the current share price. All of this is available in an easy to use tool on the Community page that updates automatically when new data such as earnings or news arrives. One investor might build a Narrative that reflects confidence in minimally invasive and robotic assisted surgery, stronger margins and a fair value closer to the more bullish US$68.00 analyst target. Another might focus on risks like supply chain pressures, competition and capital spending, and land nearer the more cautious US$57.00 target instead.
Do you think there's more to the story for CONMED? Head over to our Community to see what others are saying!

This article by Simply Wall St is general in nature. We provide commentary based on historical data and analyst forecasts only using an unbiased methodology and our articles are not intended to be financial advice. It does not constitute a recommendation to buy or sell any stock, and does not take account of your objectives, or your financial situation. We aim to bring you long-term focused analysis driven by fundamental data. Note that our analysis may not factor in the latest price-sensitive company announcements or qualitative material. Simply Wall St has no position in any stocks mentioned.
Have feedback on this article? Concerned about the content? Get in touch with us directly. Alternatively, email editorial-team@simplywallst.com