
- PREMIUM
- LIVE QUOTES
- INSTITUTIONS
 Index Options
 State Street
 CME Group
 Nasdaq
 Cboe
Cboe TradingView
 Wall Street Journal
Is Sea (SE) Priced Right After A 32% One Year Share Price Jump?
- If you are wondering whether Sea's share price still makes sense after a strong run, this article walks through what the current price might imply about its underlying value.
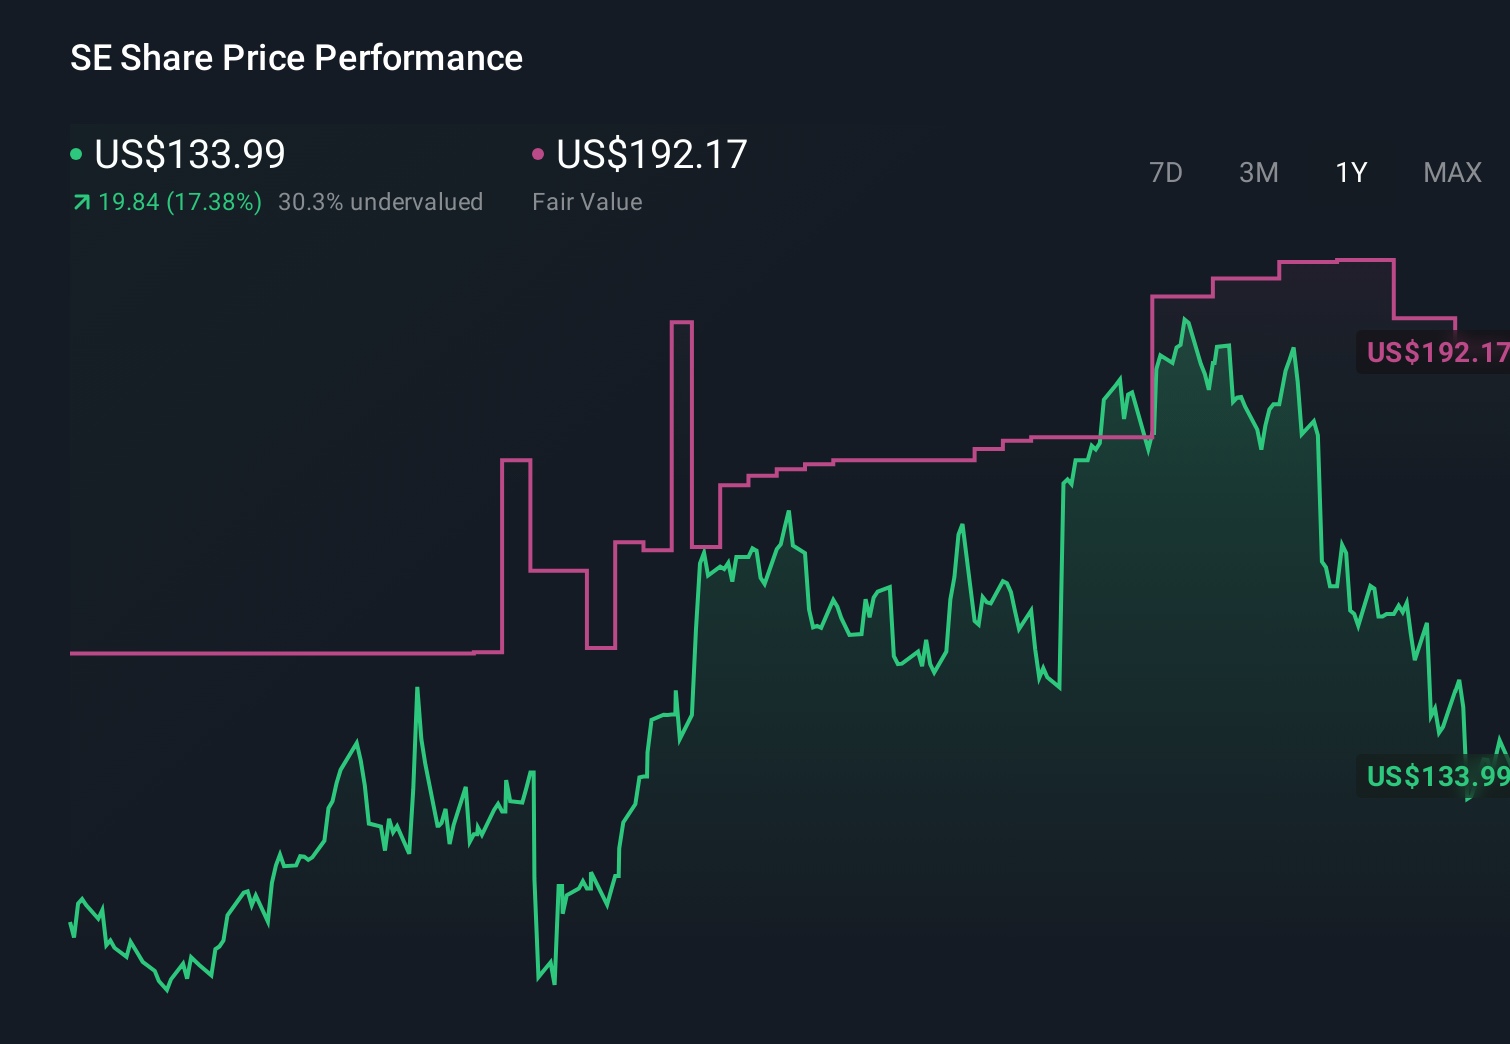
- Sea's stock has seen large swings recently, with returns of 8.9% over the past week, 4.3% over the past month, 6.3% year to date, 31.3% over the past year and 157.8% over three years, while the five year return sits at a 36.0% decline.
- Recent attention on Sea has largely centered on its mix of businesses, including digital entertainment, e commerce and digital financial services. Investors are weighing how each segment contributes to the overall story. Alongside that, commentary has focused on how Sea is balancing growth opportunities with efficiency and capital allocation priorities, which can influence how the market prices the stock.
- In this context, Sea currently has a value score of 3 out of 6. This suggests some checks point to potential undervaluation while others are more mixed. We will look at what different valuation approaches indicate about that, before finishing with a framework that can help you make better sense of the numbers.
Approach 1: Sea Discounted Cash Flow (DCF) Analysis
A Discounted Cash Flow, or DCF, model takes estimates of the cash a company could generate in the future and discounts those amounts back to today to arrive at an estimated intrinsic value per share.
For Sea, the model used is a 2 Stage Free Cash Flow to Equity approach based on cash flow projections. The latest twelve month free cash flow is about $3.58b. Analyst inputs extend out to 2030, where free cash flow is projected at $8.42b, with additional estimates and extrapolations for the following years. These projections are all converted into today’s dollars using a discount rate, which gives the series of discounted values shown for 2026 through 2035.
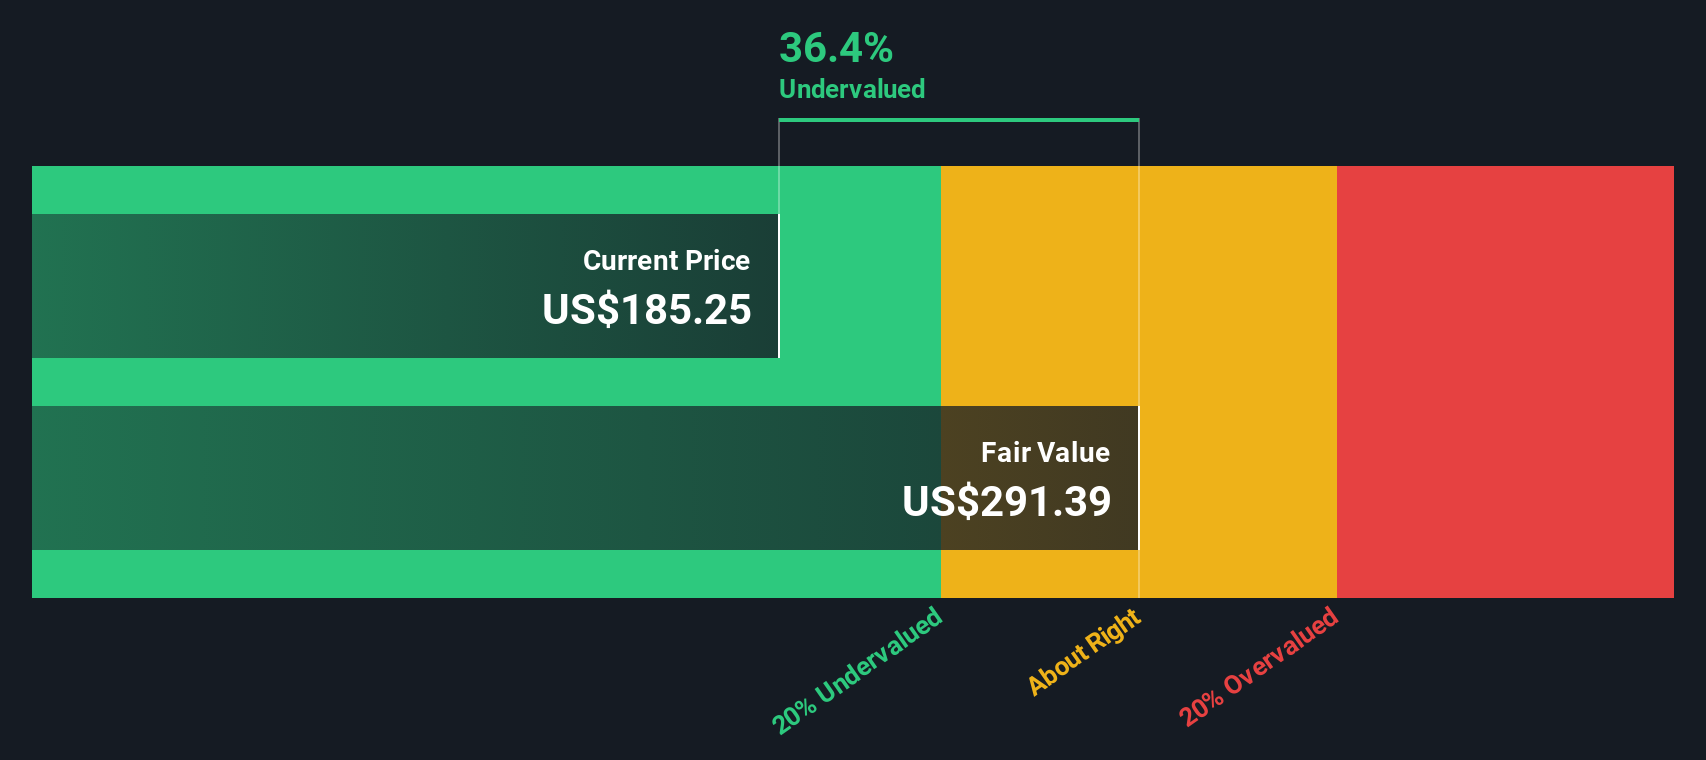
When all those discounted cash flows are added up, the DCF model suggests an intrinsic value of about $276.12 per share. Compared with the current share price, this implies the stock is trading at a 49.4% discount to that estimate, which indicates potential undervaluation based on this cash flow view.
Result: UNDERVALUED
Our Discounted Cash Flow (DCF) analysis suggests Sea is undervalued by 49.4%. Track this in your watchlist or portfolio, or discover 878 more undervalued stocks based on cash flows.
Approach 2: Sea Price vs Earnings
For profitable companies, the P/E ratio is a useful way to link what you pay for a share to the earnings that each share currently generates. It helps you see how many dollars of price the market is asking for every dollar of earnings.
What counts as a “normal” P/E depends a lot on how the market views a company’s growth prospects and risk. Higher expected growth or lower perceived risk can support a higher multiple, while slower growth or higher risk usually calls for a lower one.
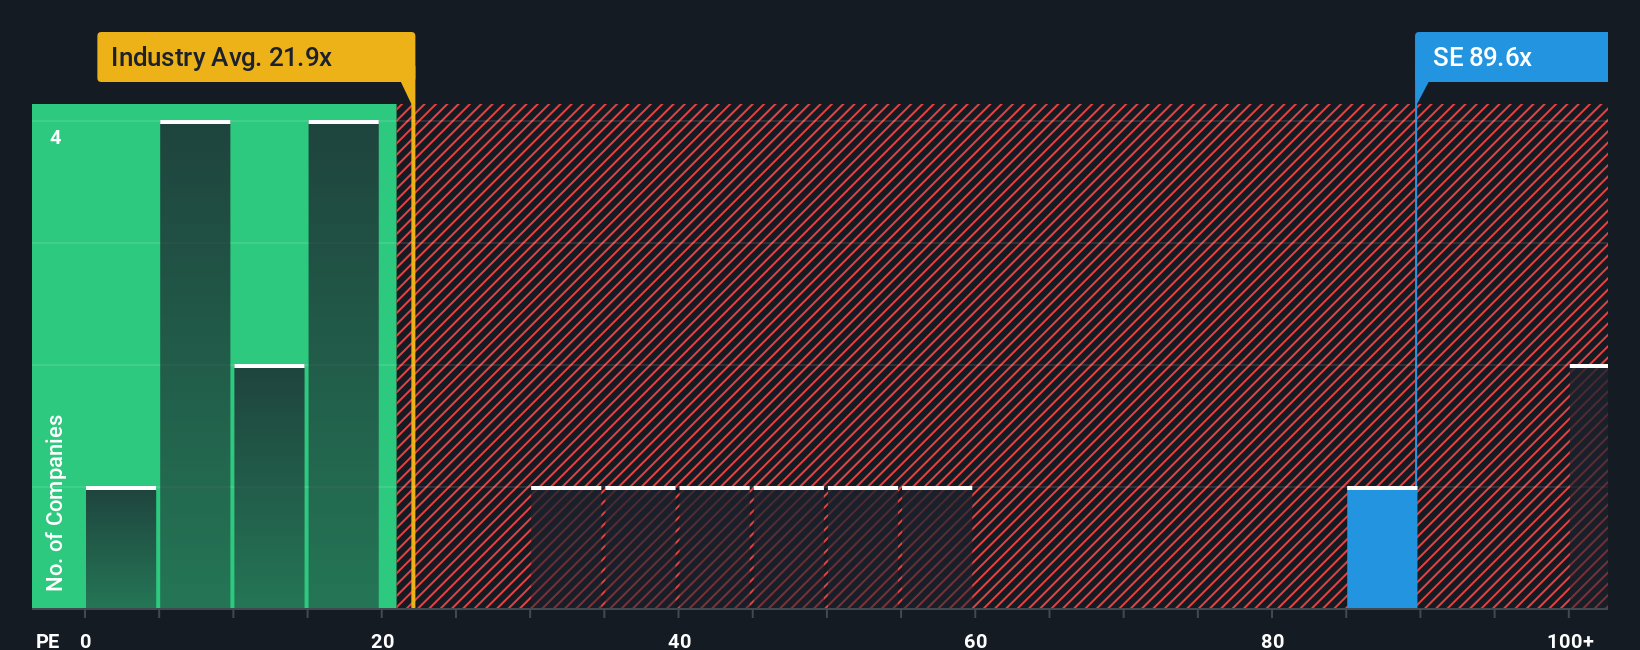
Sea currently trades on a P/E of 58.34x. That is above the Multiline Retail industry average of 19.41x and also above the peer group average of 46.95x. Simply Wall St’s Fair Ratio for Sea is 35.14x. This Fair Ratio is a proprietary estimate of the P/E that might be reasonable given factors such as Sea’s earnings growth profile, profit margins, industry, market cap and specific risks.
Because the Fair Ratio builds in these company specific factors, it can be more informative than a simple comparison with peers or the broad industry. With Sea’s actual P/E of 58.34x sitting well above the Fair Ratio of 35.14x, this points to the shares looking expensive on this metric.
Result: OVERVALUED
P/E ratios tell one story, but what if the real opportunity lies elsewhere? Discover 1457 companies where insiders are betting big on explosive growth.
Upgrade Your Decision Making: Choose your Sea Narrative
Earlier we mentioned that there is an even better way to understand valuation. Let us introduce you to Narratives, a simple tool on Simply Wall St’s Community page that lets you connect your view of Sea’s story to specific numbers for future revenue, earnings and margins. You can tie that forecast to your own fair value, and then compare that fair value with today’s price to decide whether the stock looks attractive or not. The whole picture updates as new news or earnings arrive. One investor might build a Narrative closer to the higher US$241.00 fair value, while another leans toward the more cautious US$165.00 view. You can immediately see how those different stories translate into very different conclusions about Sea.
Do you think there's more to the story for Sea? Head over to our Community to see what others are saying!
This article by Simply Wall St is general in nature. We provide commentary based on historical data and analyst forecasts only using an unbiased methodology and our articles are not intended to be financial advice. It does not constitute a recommendation to buy or sell any stock, and does not take account of your objectives, or your financial situation. We aim to bring you long-term focused analysis driven by fundamental data. Note that our analysis may not factor in the latest price-sensitive company announcements or qualitative material. Simply Wall St has no position in any stocks mentioned.
Have feedback on this article? Concerned about the content? Get in touch with us directly. Alternatively, email editorial-team@simplywallst.com