
- PREMIUM
- LIVE QUOTES
- INSTITUTIONS
 Index Options
 State Street
 CME Group
 Nasdaq
 Cboe
Cboe TradingView
 Wall Street Journal
Is There Now An Opportunity In Dow (DOW) After Mixed Long Term Returns?
- If you are wondering whether Dow's current share price lines up with its underlying worth, you are not alone. This article is designed to walk you through that question clearly.
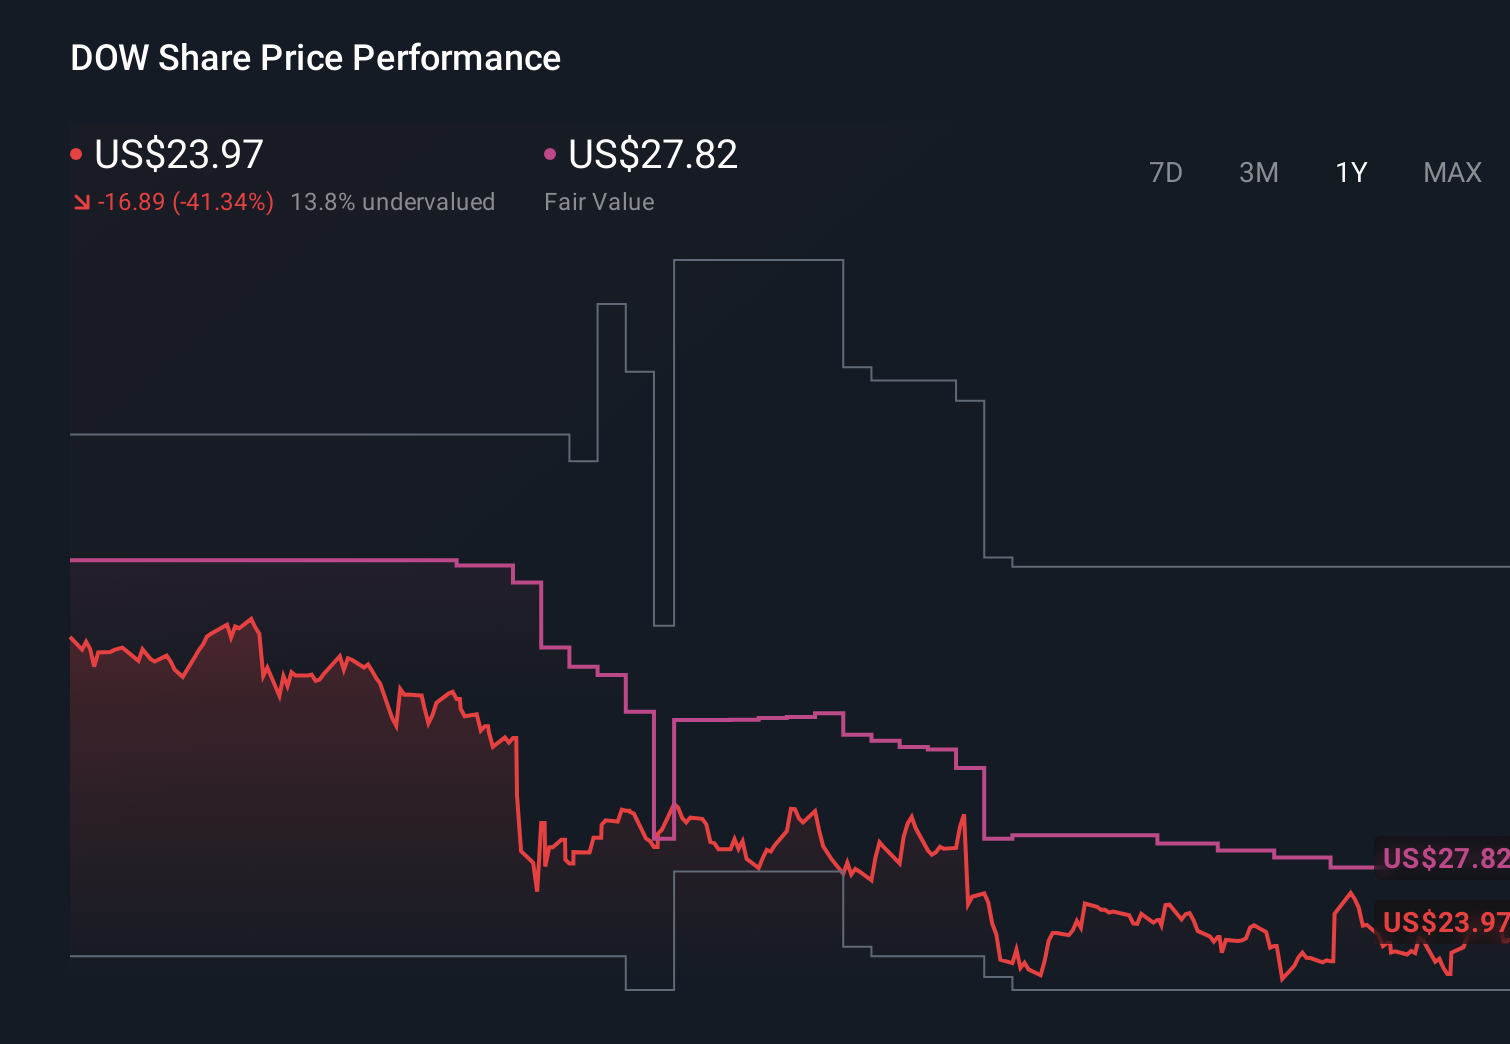
- Over the very short term, Dow's share price has moved, with a 5.9% return over the last 7 days, 8.4% over 30 days, and 2.6% year to date, although the 1 year return of negative 32.1% and 3 year return of negative 47.3% show a very different picture.
- Recent coverage of Dow has focused on how the company fits into the broader materials sector and how investors are weighing its cyclical exposure against its balance sheet and cash generation. This mix of short term gains and longer term share price pressure is shaping how people think about its potential risk and reward today.
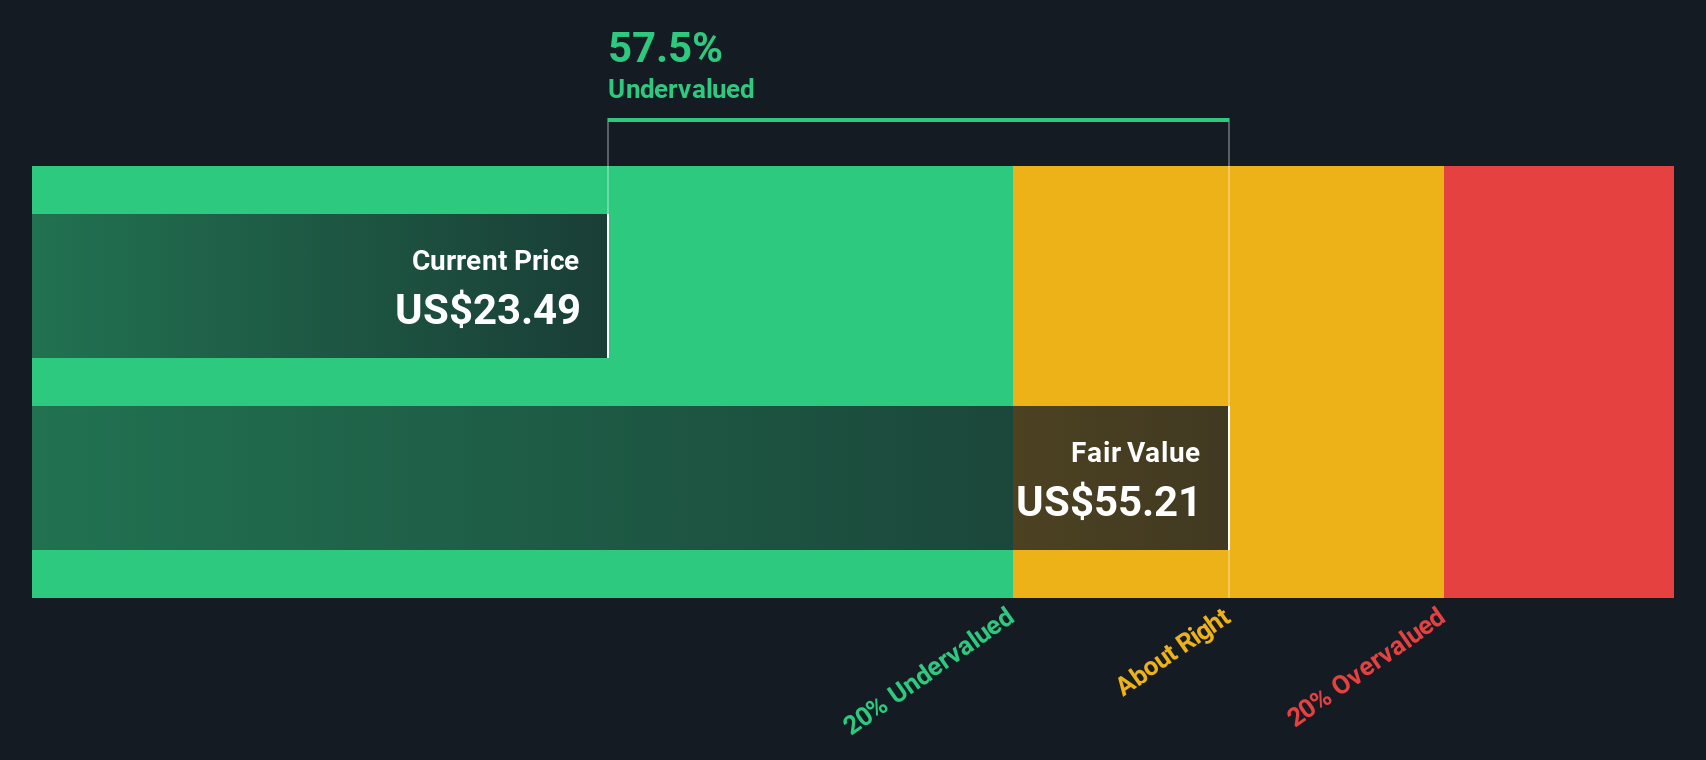
- Simply Wall St currently gives Dow a valuation score of 3 out of 6, meaning it screens as undervalued on half of the checks used. Next we will look at the standard valuation methods that drive that score before finishing with a more complete way to think about what "value" really means for this stock.
Find out why Dow's -32.1% return over the last year is lagging behind its peers.
Approach 1: Dow Dividend Discount Model (DDM) Analysis
The Dividend Discount Model looks at a stock by asking a simple question: if you only cared about the future dividends, what would those payments be worth to you in today's dollars?
For Dow, the model starts with an annual dividend per share of $1.39 and a return on equity of 6.41%. The calculated payout ratio is about 151.19%, which means the company is paying out more in dividends than it is generating in earnings. Using the standard DDM formula, this leads to an expected dividend growth rate of about 3.28% decline per year, based on the source calculation of (1 minus 151.19%) multiplied by 6.41%.
When these projected dividends are discounted back, the DDM output is an intrinsic value of $12.53 per share. That figure implies the stock is about 98.7% overvalued relative to the current share price used in the model.
Result: OVERVALUED
Our Dividend Discount Model (DDM) analysis suggests Dow may be overvalued by 98.7%. Discover 878 undervalued stocks or create your own screener to find better value opportunities.
Approach 2: Dow Price vs Sales (P/S)
For a company like Dow, where earnings can swing around, the Price to Sales ratio is a useful way to look at what you are paying for each dollar of revenue, regardless of short term profit noise.
In general, investors tend to accept a higher or lower “normal” P/S depending on what they expect for future growth and how much risk they see in the business. Higher expected growth and lower perceived risk usually support a higher multiple, while weaker growth or higher risk usually pull it down.
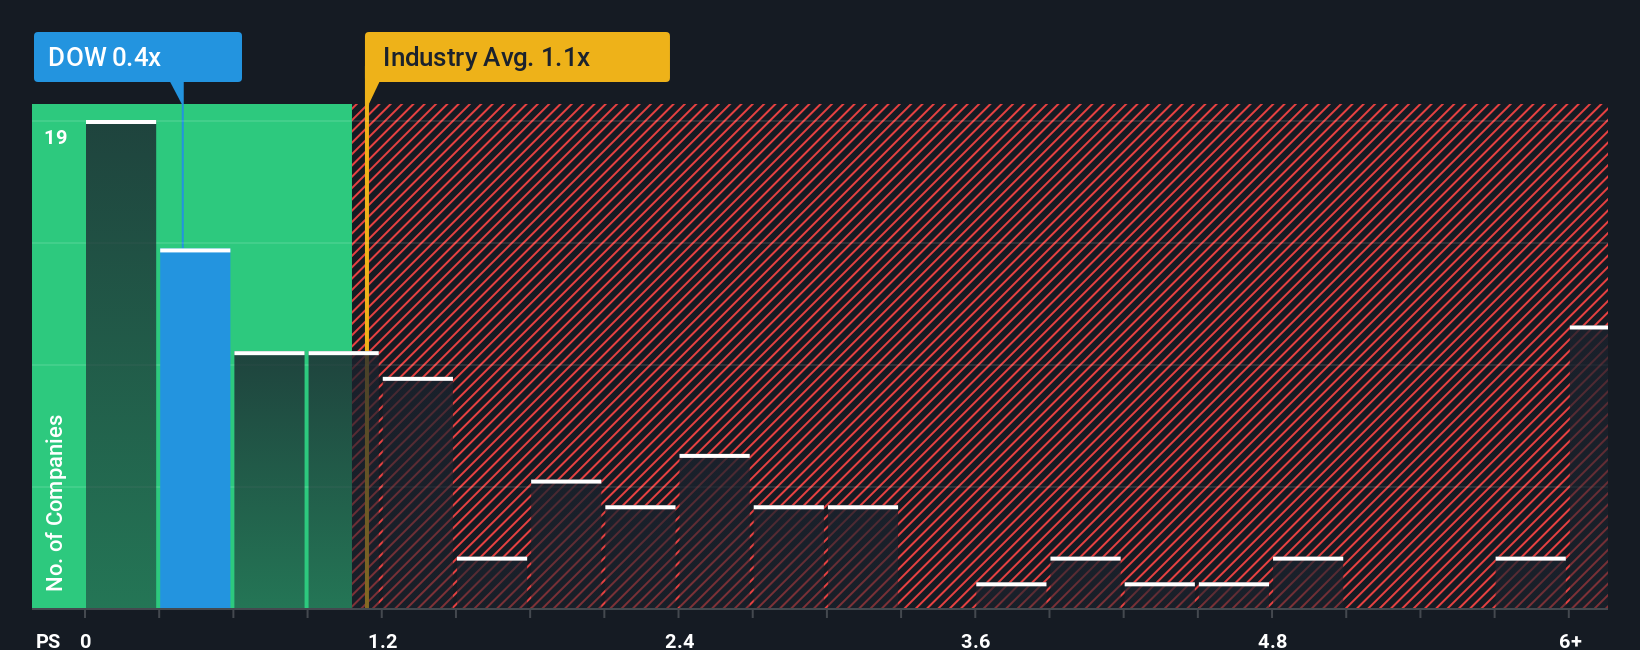
Dow currently trades on a P/S of 0.43x. That sits below the Chemicals industry average P/S of 1.08x and also below the peer group average of 0.64x. On the surface, that suggests the market is pricing Dow’s sales at a discount to many of its peers.
Simply Wall St’s Fair Ratio for Dow is 0.87x. This is a proprietary estimate of what a reasonable P/S might be once you factor in the company’s earnings profile, industry, profit margin, market cap and key risks. That makes it more tailored than a simple peer or industry comparison.
With the current P/S of 0.43x sitting well below the Fair Ratio of 0.87x, the shares appear undervalued on this metric.
Result: UNDERVALUED
P/S ratios tell one story, but what if the real opportunity lies elsewhere? Discover 1457 companies where insiders are betting big on explosive growth.
Upgrade Your Decision Making: Choose your Dow Narrative
Earlier we mentioned that there is an even better way to understand valuation. On Simply Wall St’s Community page you can build or browse “Narratives,” where you or other investors connect Dow’s story to a set of forecasts for revenue, earnings, margins and a fair value. You can then compare that fair value with today’s price, see it update as fresh news or earnings are added, and weigh very different viewpoints, such as a more optimistic Dow Narrative that targets US$45.00 or a more cautious one at US$20.00, against your own expectations.
Do you think there's more to the story for Dow? Head over to our Community to see what others are saying!
This article by Simply Wall St is general in nature. We provide commentary based on historical data and analyst forecasts only using an unbiased methodology and our articles are not intended to be financial advice. It does not constitute a recommendation to buy or sell any stock, and does not take account of your objectives, or your financial situation. We aim to bring you long-term focused analysis driven by fundamental data. Note that our analysis may not factor in the latest price-sensitive company announcements or qualitative material. Simply Wall St has no position in any stocks mentioned.
Have feedback on this article? Concerned about the content? Get in touch with us directly. Alternatively, email editorial-team@simplywallst.com