
- PREMIUM
- LIVE QUOTES
- INSTITUTIONS
 Index Options
 State Street
 CME Group
 Nasdaq
 Cboe
Cboe TradingView
 Wall Street Journal
Is It Too Late To Consider Nu Holdings (NU) After A 60% One Year Rally?
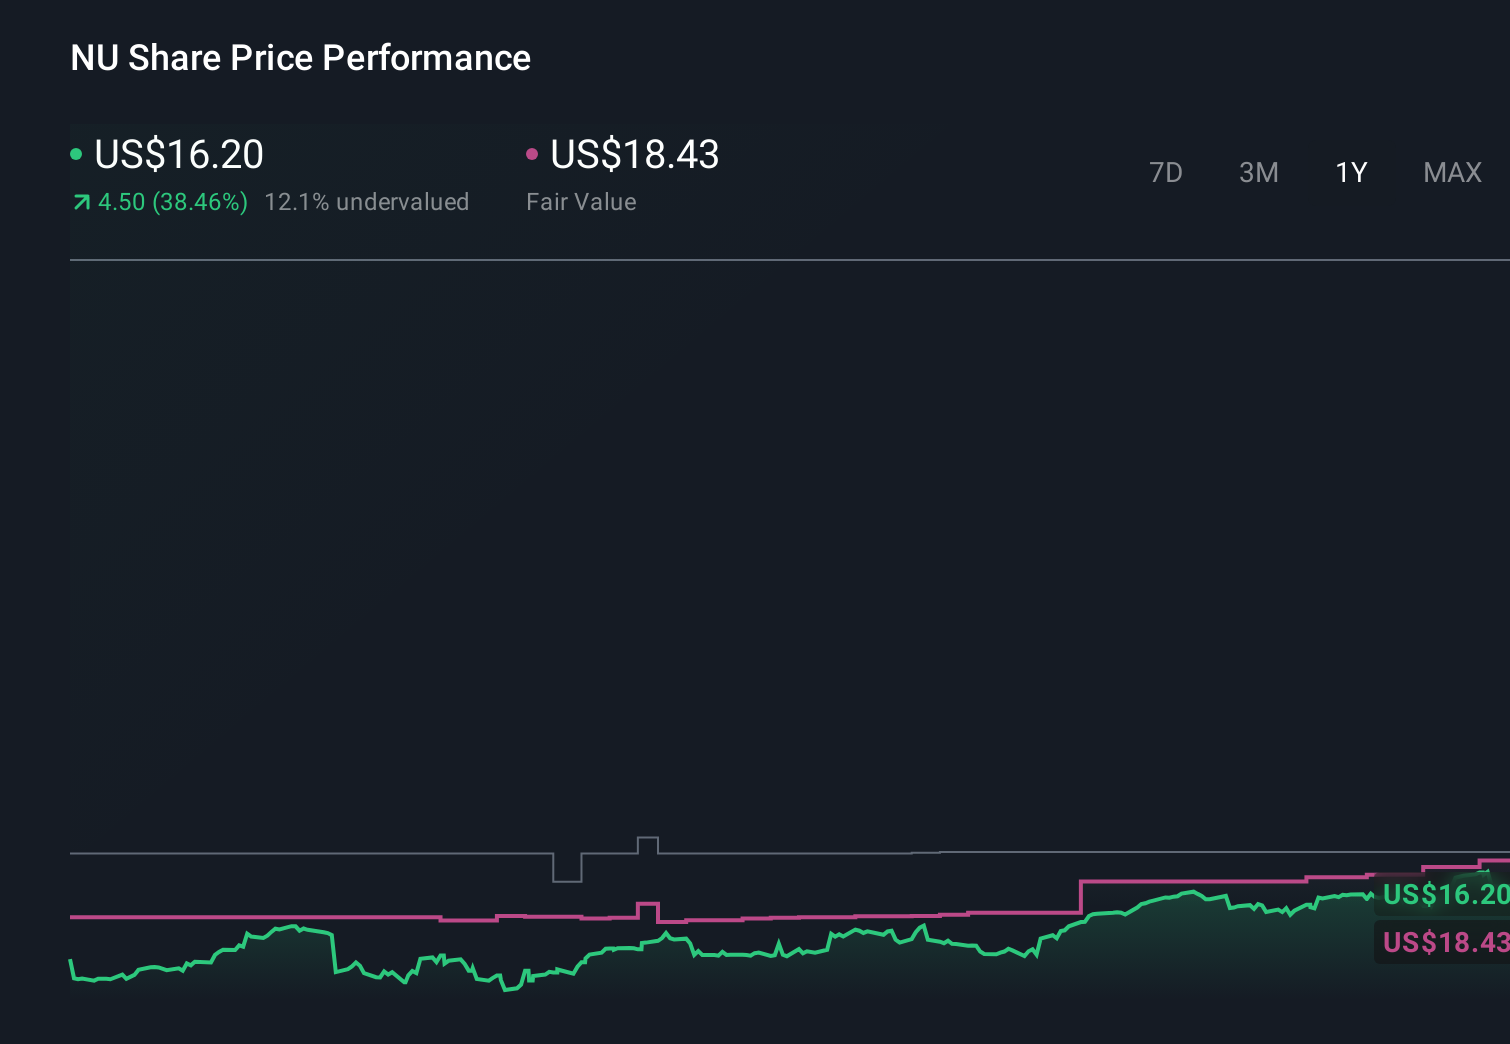
- If you are wondering whether Nu Holdings at US$17.94 is still reasonably priced after its strong run, this article walks through what the current market price may be implying about value.
- The stock has posted returns of 6.3% over 7 days, 7.4% over 30 days, 5.4% year to date and 60.8% over the past year, with a very large 3 year gain of about 4x.
- Recent attention on Nu Holdings has focused on its rapid customer growth in Latin American digital banking and its expanding product ecosystem. Many investors see these developments as important context for the share price moves. Coverage has also highlighted how large global financial institutions and fintech peers are responding to this kind of digital banking model, which shapes how the market thinks about Nu's long term potential and risks.
- Right now, our valuation checks give Nu Holdings a score of 0/6. In the sections that follow, we will run through what different valuation approaches say about that result and then finish with a way of looking at valuation that many investors find even more useful.
Nu Holdings scores just 0/6 on our valuation checks. See what other red flags we found in the full valuation breakdown.
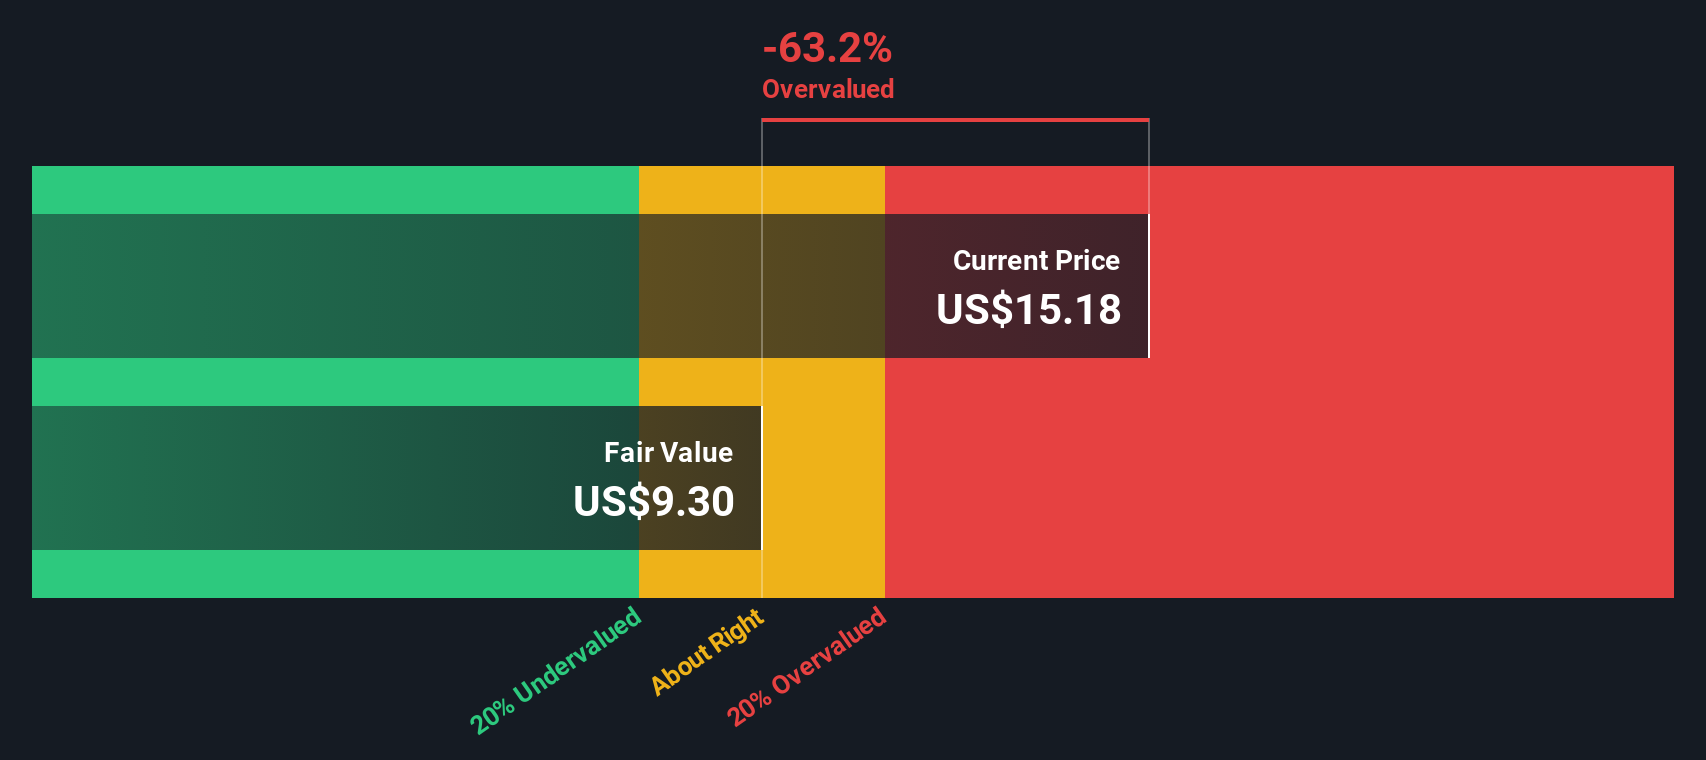
Approach 1: Nu Holdings Excess Returns Analysis
The Excess Returns model looks at how much profit a company can generate over and above the return that shareholders require, and then capitalizes those extra profits into a value per share.
For Nu Holdings, the model starts with a Book Value of $2.18 per share and a Stable EPS estimate of $1.13 per share, based on weighted future Return on Equity estimates from 9 analysts. The Average Return on Equity used in the model is 30.83%, while the Cost of Equity is set at $0.43 per share. The difference between what the company is expected to earn and what shareholders require is the Excess Return, calculated here at $0.70 per share.
The model also incorporates a Stable Book Value of $3.65 per share, based on weighted future Book Value estimates from 6 analysts. Putting these inputs together, the Excess Returns approach arrives at an intrinsic value of about $12.00 per share, which suggests the current price is about 49.5% higher than this estimate.
Result: OVERVALUED
Our Excess Returns analysis suggests Nu Holdings may be overvalued by 49.5%. Discover 878 undervalued stocks or create your own screener to find better value opportunities.
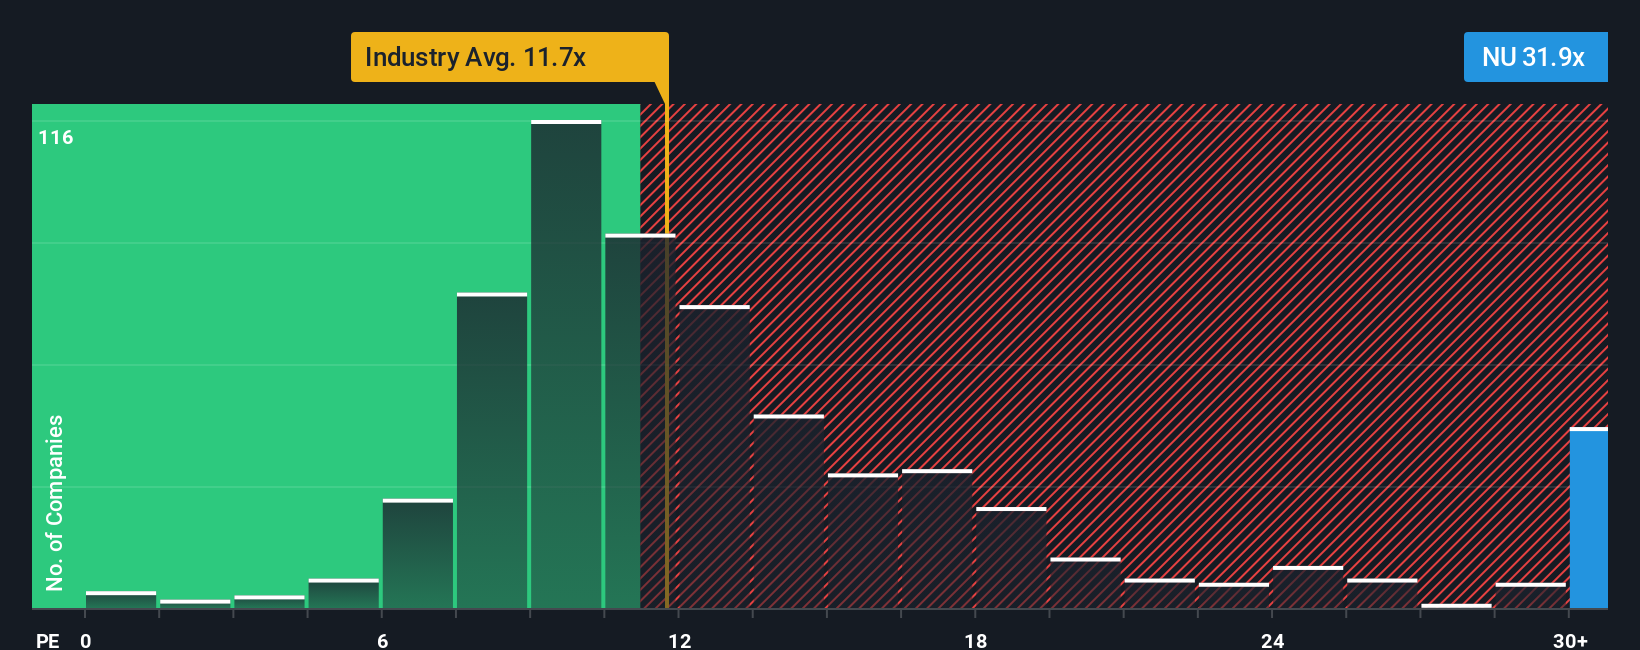
Approach 2: Nu Holdings Price vs Earnings
For a profitable company like Nu Holdings, the P/E ratio is a useful way to think about what you are paying for each dollar of current earnings. A higher or lower P/E can make sense depending on how the market views the company’s growth prospects and risk profile, so there is no single “correct” number.
Right now, Nu Holdings trades on a P/E of 34.37x. That sits well above the Banks industry average of 11.79x and also above the peer group average of 13.70x. On those simple comparisons, the shares look expensive relative to sector norms and similar companies.
Simply Wall St’s Fair Ratio concept goes a step further. It estimates what a more tailored P/E might look like, at 23.77x for Nu Holdings, after accounting for factors such as earnings growth, profit margins, industry, market cap and specific risks. This makes it more targeted than just lining the stock up against broad industry or peer averages. Comparing the current P/E of 34.37x with the Fair Ratio of 23.77x suggests that Nu Holdings is trading at a premium to what that framework indicates.
Result: OVERVALUED
P/E ratios tell one story, but what if the real opportunity lies elsewhere? Discover 1457 companies where insiders are betting big on explosive growth.
Upgrade Your Decision Making: Choose your Nu Holdings Narrative
Earlier we mentioned that there is an even better way to understand valuation. Let us introduce you to Narratives, where you write a clear story about Nu Holdings, connect that story to your own revenue, earnings and margin assumptions, and then see the fair value that emerges. All of this happens inside Simply Wall St’s Community page that millions of investors use to compare their view against others, track how fair value vs price might guide their buy or sell decisions, and automatically refresh that story as new earnings or news arrive. Whether you lean closer to a higher fair value like US$20.00 because you focus on factors such as international expansion and product breadth, or a lower fair value like US$14.00 because you are more focused on competition, credit quality and regulation, Narratives can help you structure your thinking.
Do you think there's more to the story for Nu Holdings? Head over to our Community to see what others are saying!
This article by Simply Wall St is general in nature. We provide commentary based on historical data and analyst forecasts only using an unbiased methodology and our articles are not intended to be financial advice. It does not constitute a recommendation to buy or sell any stock, and does not take account of your objectives, or your financial situation. We aim to bring you long-term focused analysis driven by fundamental data. Note that our analysis may not factor in the latest price-sensitive company announcements or qualitative material. Simply Wall St has no position in any stocks mentioned.
Have feedback on this article? Concerned about the content? Get in touch with us directly. Alternatively, email editorial-team@simplywallst.com