
- PREMIUM
- LIVE QUOTES
- INSTITUTIONS
 Index Options
 State Street
 CME Group
 Nasdaq
 Cboe
Cboe TradingView
 Wall Street Journal
Arthur J. Gallagher (AJG) Valuation Check After Earnings Miss And Revenue Growth Disappointment
Arthur J. Gallagher (AJG) is back in focus after its latest quarterly update, with revenue of US$3.37b that grew 21.2% year on year but missed analyst expectations, pressuring both earnings and the share price.
See our latest analysis for Arthur J. Gallagher.
The latest quarter’s miss has come after a mixed stretch for investors, with the share price at US$263.24, a 9.82% 1 month share price return but a 14.24% 3 month share price decline. The 5 year total shareholder return of 134.19% contrasts with a 5.08% 1 year total shareholder return decline, suggesting long term momentum is intact even as near term sentiment has cooled following weaker results.
If this earnings reaction has you reconsidering your watchlist, it could be a good moment to look beyond insurance brokers and check out Is Arthur J. Gallagher financially strong enough to weather the next crisis?.
With AJG trading at US$263.24, alongside an indicated intrinsic discount of around 25% and a gap to analyst price targets, is the recent weakness a window to buy or is the market already pricing in future growth?
Most Popular Narrative: 14.7% Undervalued
Against AJG's last close of US$263.24, the most followed narrative points to a higher fair value, framing the recent pullback as a valuation gap to watch.
Street research following the Q3 report reflects a more nuanced view of Arthur J. Gallagher, with modest target cuts and select raises signaling a recalibration of expectations rather than a fundamental shift in the long term story.
Bullish analysts highlight that, despite a mixed quarter, management reaffirmed 2026 organic growth guidance of 6 percent plus. This supports a premium valuation framework tied to durable mid single digit to high single digit growth.
Curious how a modest tweak to growth, margin and future P/E assumptions still supports a premium price tag for AJG? The narrative leans heavily on recurring, higher margin brokerage and risk management earnings, plus disciplined deal making. Want to see exactly how those moving parts translate into that higher fair value line?
Result: Fair Value of $308.47 (UNDERVALUED)
Have a read of the narrative in full and understand what's behind the forecasts.
However, this narrative can be knocked off course if acquisition integration stumbles, or if ongoing pricing pressure and disintermediation start to squeeze brokerage margins more than expected.
Find out about the key risks to this Arthur J. Gallagher narrative.
Another Angle on Valuation
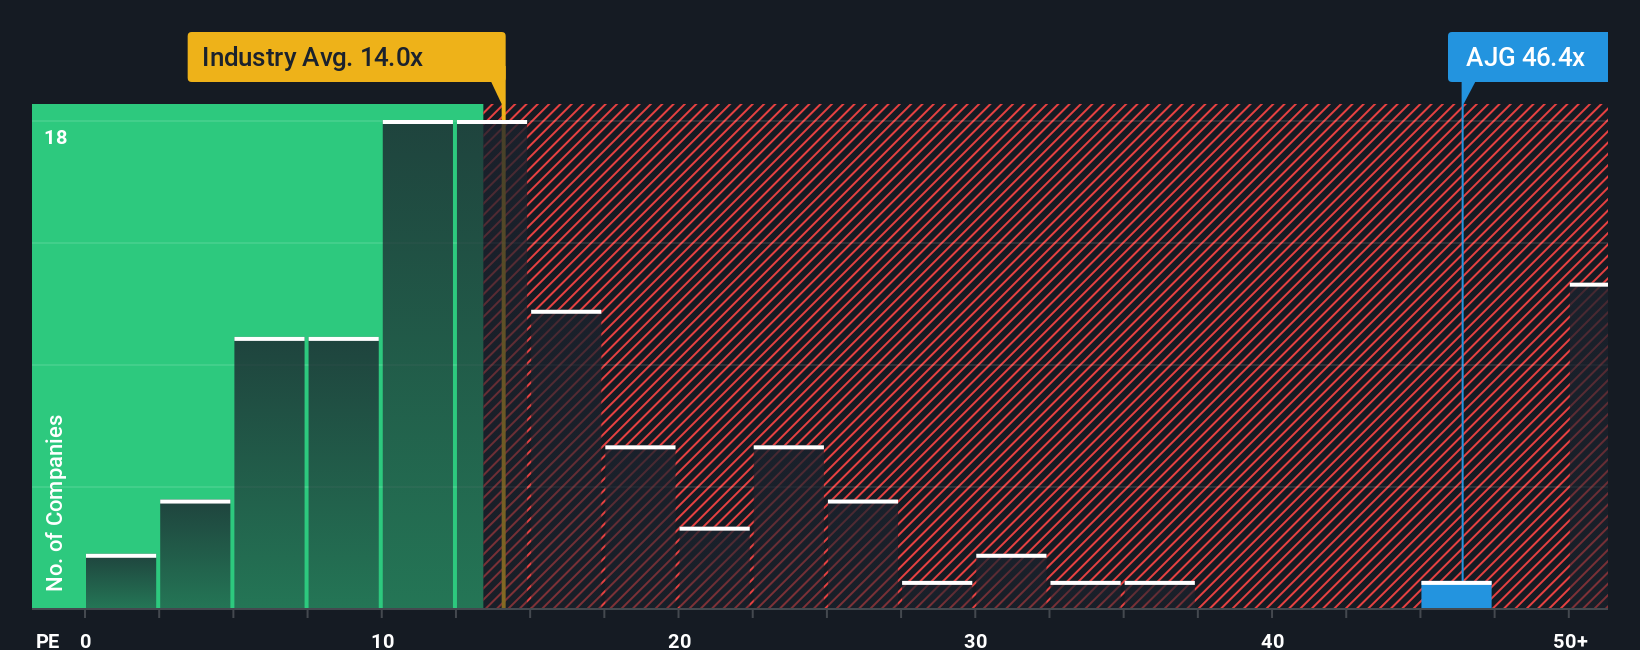
That 14.7% “undervalued” call sits awkwardly next to how the market is currently pricing Arthur J. Gallagher. The shares trade on a P/E of 42.2x, compared with a fair ratio of 19x, an industry average of 13x and a peer average of 23.2x.
Put simply, the market is already paying a lot more for each dollar of AJG earnings than it does for the sector and for similar companies, and well above where the fair ratio suggests it could settle over time. Is that premium a cushion of confidence or a valuation risk you are willing to carry?
See what the numbers say about this price — find out in our valuation breakdown.
Build Your Own Arthur J. Gallagher Narrative
If you are not fully convinced by this view or simply prefer to test your own assumptions against the numbers, you can build a custom thesis in minutes by starting with Do it your way.
A great starting point for your Arthur J. Gallagher research is our analysis highlighting 3 key rewards and 3 important warning signs that could impact your investment decision.
Looking for more investment ideas?
If AJG has sharpened your thinking, do not stop here. Widen your hunting ground and line up a few more ideas that fit your style.
- Target potential bargains by scanning these 878 undervalued stocks based on cash flows that align with the kind of pricing gap you want to track.
- Spot early movers in machine learning and automation by checking out these 25 AI penny stocks that match your growth appetite.
- Tap into income opportunities by reviewing these 14 dividend stocks with yields > 3% that might suit a yield focused watchlist.
This article by Simply Wall St is general in nature. We provide commentary based on historical data and analyst forecasts only using an unbiased methodology and our articles are not intended to be financial advice. It does not constitute a recommendation to buy or sell any stock, and does not take account of your objectives, or your financial situation. We aim to bring you long-term focused analysis driven by fundamental data. Note that our analysis may not factor in the latest price-sensitive company announcements or qualitative material. Simply Wall St has no position in any stocks mentioned.
Have feedback on this article? Concerned about the content? Get in touch with us directly. Alternatively, email editorial-team@simplywallst.com