
- PREMIUM
- LIVE QUOTES
- INSTITUTIONS
 Index Options
 State Street
 CME Group
 Nasdaq
 Cboe
Cboe TradingView
 Wall Street Journal
The S&P 500 Just Did Something for the 5th Time in 97 Years. Here's What History Says May Happen in 2026.
Key Points
The S&P 500 finished 2025 up by 16% or more for the third consecutive year.
This has happened only five times in the S&P 500's history.
History suggests that the index could either soar again in 2026 -- or fall by a double-digit percentage.
Some things happen so infrequently that they grab your attention. Seeing a total solar eclipse is a good example. So is hitting a hole in one in a round of golf.
The S&P 500 (SNPINDEX: ^GSPC) just did something that should grab investors' attention. And it could provide a glimpse into what may happen with stocks in the new year.
Where to invest $1,000 right now? Our analyst team just revealed what they believe are the 10 best stocks to buy right now, when you join Stock Advisor. See the stocks »

Image source: Getty Images.
Sweet 16
The S&P 500 ended 2025 up 16.4%. This performance followed a gain of 23.3% in 2024 and 24.2% in 2023. The index has generated returns of over 16% for three consecutive years only five times in 97 years. (Note: I'm including nominal returns only and not total returns with dividends.)
Granted, the S&P 500 hasn't existed in its current form that long. The index didn't include 500 companies until 1957. However, a predecessor – the S&P 90 Stock Index – debuted in 1928.
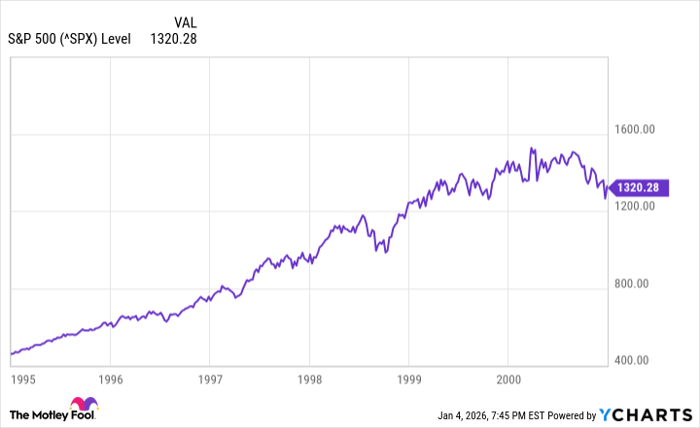
However, we don't have to go back that far to find the earliest instance of the index rising by 16% or more in three consecutive years. It first occurred from 1995 to 1997, during the dot-com boom. That boom produced two of the other notable streaks of 16%+ gains, from 1996 to 1998 and 1997 to 1999.
Two decades passed before the next three consecutive years of returns of 16% or more. The S&P 500 gained 28.9% in 2019, 16.3% in 2020, and 26.9% in 2021. The most recent streak, from 2023 to 2025, rounds out the list.
A mixed record
What typically happens next after three consecutive years of the S&P 500 delivering gains of 16% or more? History provides a mixed record.
Following the first streak from 1995 to 1997, the S&P 500 soared another 26.7% in 1998. After the next three years of gains of 16% or more between 1996 and 1998, the index jumped 19.5% in 1999.
However, the stock market bubble burst following the three consecutive years of 16% or more gains from 1997 to 1999. The S&P 500 declined 10.1% in 2000, marking the start of a prolonged decline that lasted several years.
Anyone who has invested in recent years is aware of what happened following the three years of 16% or more returns between 2019 and 2021. The Federal Reserve began cranking up interest rates in 2022 in response to skyrocketing inflation. The S&P 500 plunged 19.4% as a result.
What's in store for 2026?
Historical precedents are murky at best for how the S&P 500 may perform in 2026. We could see continued momentum similar to the boom in the 1990s. On the other hand, the S&P 500 could decline in 2026 as it did in two of the four previous cases when the index delivered gains of 16% or more for three consecutive years.
In the 1990s, the rapid adoption of e-commerce fueled a significant surge in the stock market. Today, we're seeing a similar trend driven by artificial intelligence (AI), particularly generative AI. If companies report significant returns from their investments in AI this year, the S&P 500 could again deliver substantial gains in 2026.
However, the good times for the S&P 500 came to an end in 2000, mainly due to the index's steep valuation. The S&P 500 Shiller CAPE ratio, a widely followed valuation metric, is currently at its highest level since then. It's possible that valuation could be the downfall for the S&P 500 this year, as it was in 2000.
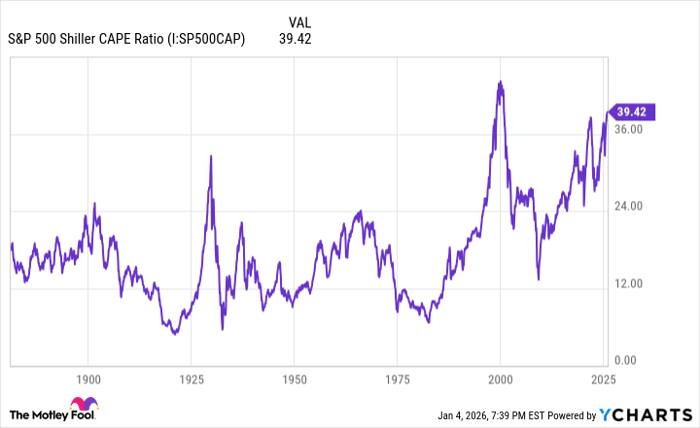
S&P 500 Shiller CAPE Ratio data by YCharts
Perhaps the best strategy for investors is to focus on another S&P 500 streak, rather than its limited number of three consecutive years of 16% or more gains. What streak am I referring to? Over rolling 20-year periods, the S&P 500 has delivered positive total returns 100% of the time. This streak bodes well for long-term investors.
Keith Speights has no position in any of the stocks mentioned. The Motley Fool has no position in any of the stocks mentioned. The Motley Fool has a disclosure policy.