
- PREMIUM
- LIVE QUOTES
- INSTITUTIONS
 Index Options
 State Street
 CME Group
 Nasdaq
 Cboe
Cboe TradingView
 Wall Street Journal
Qualcomm (QCOM) Valuation Check As CES 2026 Robotics Push Highlights Physical AI Expansion
Qualcomm (QCOM) is back in focus after using CES 2026 to showcase a full robotics stack centered on its new Dragonwing IQ10 processor, which targets industrial robots and advanced humanoids with on-device AI.
See our latest analysis for QUALCOMM.
The Dragonwing reveal comes after a string of CES announcements around Snapdragon X2 Plus PCs, automotive partnerships such as Toyota’s RAV4 using Snapdragon Digital Chassis, and ADAS software work with partners. The stock’s recent 90 day share price return of 5.09% sits alongside a 12.30% one year total shareholder return, pointing to steady but not explosive momentum into 2026.
If Qualcomm’s push into physical AI has your attention, it may be worth scanning high growth tech and AI stocks to spot other chip and AI names building out similar themes.
With QCOM up 12.30% over the past year and trading about 10% below the average analyst target, plus an internal model implying a premium, is the market overlooking Qualcomm’s physical AI push or already factoring in potential future growth?
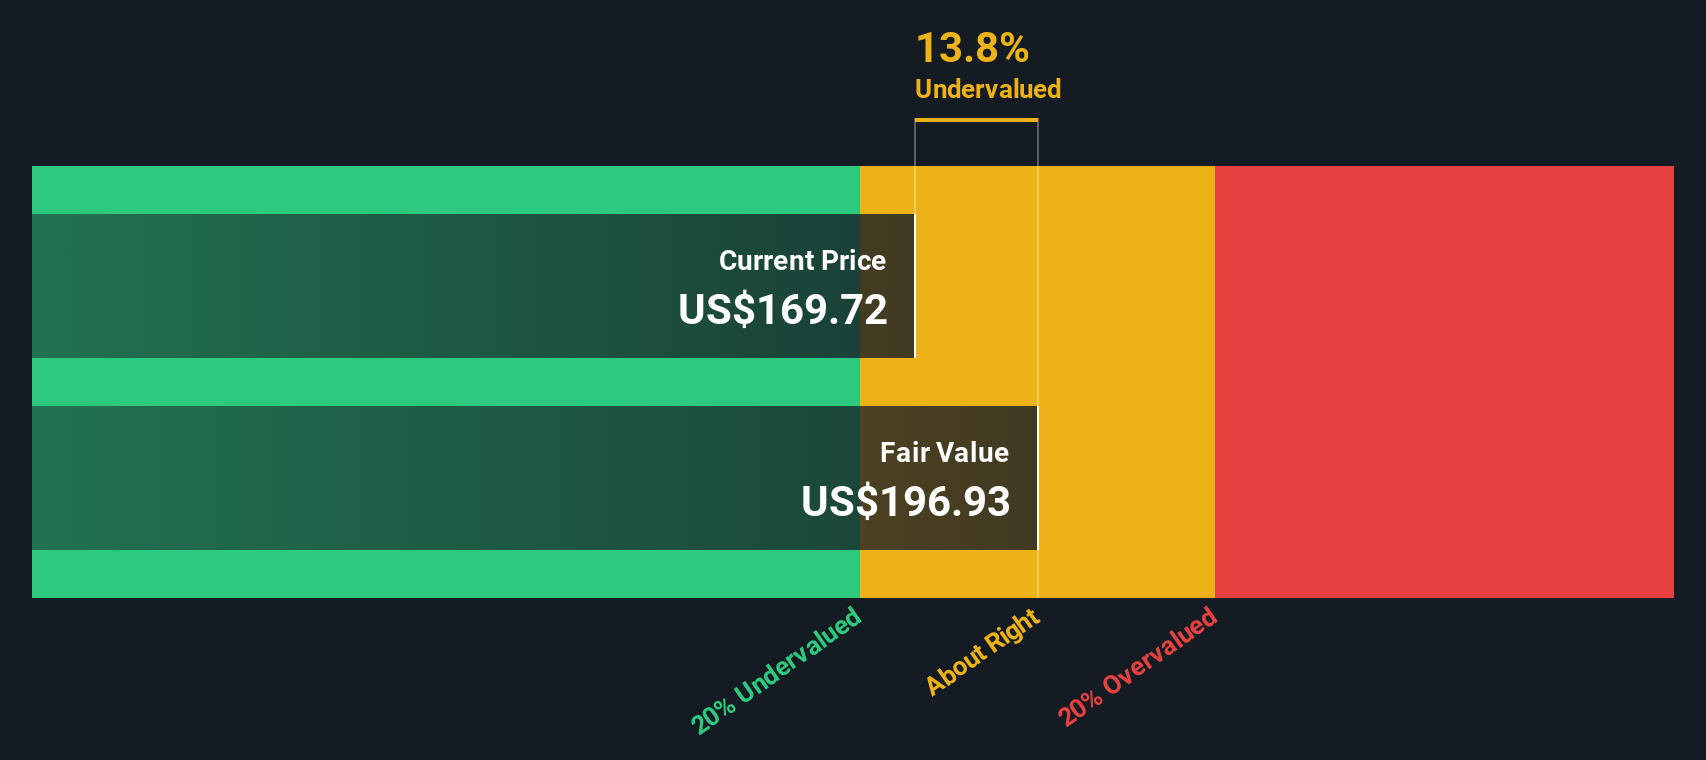
Most Popular Narrative Narrative: 8.1% Undervalued
With QUALCOMM last closing at US$176.31 against a narrative fair value of about US$191.80, the valuation case leans toward a moderate upside based on long term assumptions.
Rapid growth in automotive and industrial IoT segments, supported by strong design win momentum and a robust multi-year pipeline (with a combined $22 billion revenue target by 2029), is set to diversify Qualcomm's revenue base and drive margin-accretive growth as these businesses become a larger share of total earnings.
Want to see what sits behind that revenue mix shift, the profit margin glide path, and the earnings multiple that ties it all together? The narrative leans on measured top line growth, firm profitability assumptions, and a future valuation multiple below many peers. Curious which specific forecasts have to land for that fair value to hold up?
Result: Fair Value of $191.8 (UNDERVALUED)
Have a read of the narrative in full and understand what's behind the forecasts.
However, you still need to weigh the risk that Qualcomm’s diversification into AI data centers and accelerators fails to scale, while legal and regulatory pressure on licensing persists.
Find out about the key risks to this QUALCOMM narrative.
Another View: SWS DCF Says Overvalued
While the narrative fair value of about US$191.80 points to roughly 8.1% upside, our DCF model paints a different picture. On that view, QUALCOMM at US$176.31 sits above an estimated fair value of US$164.35, so screens as slightly overvalued instead of undervalued.
Both methods use long term assumptions but land on opposite sides of the line. This raises the real question: which set of expectations feels more realistic for QUALCOMM’s cash flows over time?
Look into how the SWS DCF model arrives at its fair value.
Simply Wall St performs a discounted cash flow (DCF) on every stock in the world every day (check out QUALCOMM for example). We show the entire calculation in full. You can track the result in your watchlist or portfolio and be alerted when this changes, or use our stock screener to discover 877 undervalued stocks based on their cash flows. If you save a screener we even alert you when new companies match - so you never miss a potential opportunity.
Build Your Own QUALCOMM Narrative
If you see the numbers differently or prefer to stress test the assumptions yourself, you can spin up your own story in just a few minutes by using Do it your way.
A great starting point for your QUALCOMM research is our analysis highlighting 3 key rewards and 1 important warning sign that could impact your investment decision.
Looking for more investment ideas?
If Qualcomm has sparked your curiosity, do not stop here. Use the screener to hunt for other stocks that fit the kind of portfolio you want to build.
- Spot potential high risk high reward names by scanning these 3557 penny stocks with strong financials that already clear a basic financial strength bar.
- Focus your attention on future facing themes by zeroing in on these 25 AI penny stocks that tie artificial intelligence to real business models.
- Target value driven opportunities by filtering for these 877 undervalued stocks based on cash flows that might trade below what their cash flows suggest.
This article by Simply Wall St is general in nature. We provide commentary based on historical data and analyst forecasts only using an unbiased methodology and our articles are not intended to be financial advice. It does not constitute a recommendation to buy or sell any stock, and does not take account of your objectives, or your financial situation. We aim to bring you long-term focused analysis driven by fundamental data. Note that our analysis may not factor in the latest price-sensitive company announcements or qualitative material. Simply Wall St has no position in any stocks mentioned.
Have feedback on this article? Concerned about the content? Get in touch with us directly. Alternatively, email editorial-team@simplywallst.com