
- PREMIUM
- LIVE QUOTES
- INSTITUTIONS
 Index Options
 State Street
 CME Group
 Nasdaq
 Cboe
Cboe TradingView
 Wall Street Journal
Is Novo Nordisk (NYSE:NVO) Attractive After Recent Share Price Weakness And DCF Upside?
- If you are wondering whether Novo Nordisk is attractively priced right now, the key question is whether the current share price reflects its long term prospects or builds in too much optimism already.
- The stock last closed at US$55.11, with returns of 7.6% over the past week, 15.1% over the past month, 5.2% year to date, a 32.6% decline over the past year, a 14.5% decline over three years, and a 68.9% gain over five years.
- Recent headlines have continued to focus on Novo Nordisk's role in diabetes and obesity treatments, which keeps attention on its long term demand outlook and competitive position. At the same time, discussion around healthcare regulation and pricing has remained a background factor that investors are watching closely.
- Novo Nordisk currently has a valuation score of 5/6. This means it screens as undervalued on most of the checks used here. Next, we will look at how different valuation methods assess the stock before finishing with a more complete way to think about its value.
Find out why Novo Nordisk's -32.6% return over the last year is lagging behind its peers.
Approach 1: Novo Nordisk Discounted Cash Flow (DCF) Analysis
A Discounted Cash Flow, or DCF, model estimates what a company might be worth today by projecting its future cash flows and discounting them back to the present.
For Novo Nordisk, the model used here is a 2 Stage Free Cash Flow to Equity approach. The latest twelve month free cash flow is DKK 67.6b, and analysts plus extrapolations produce a path that reaches projected free cash flow of DKK 145.5b in 2030. The ten year DKK projections are based on analyst estimates for the next few years, with later years extrapolated by Simply Wall St.
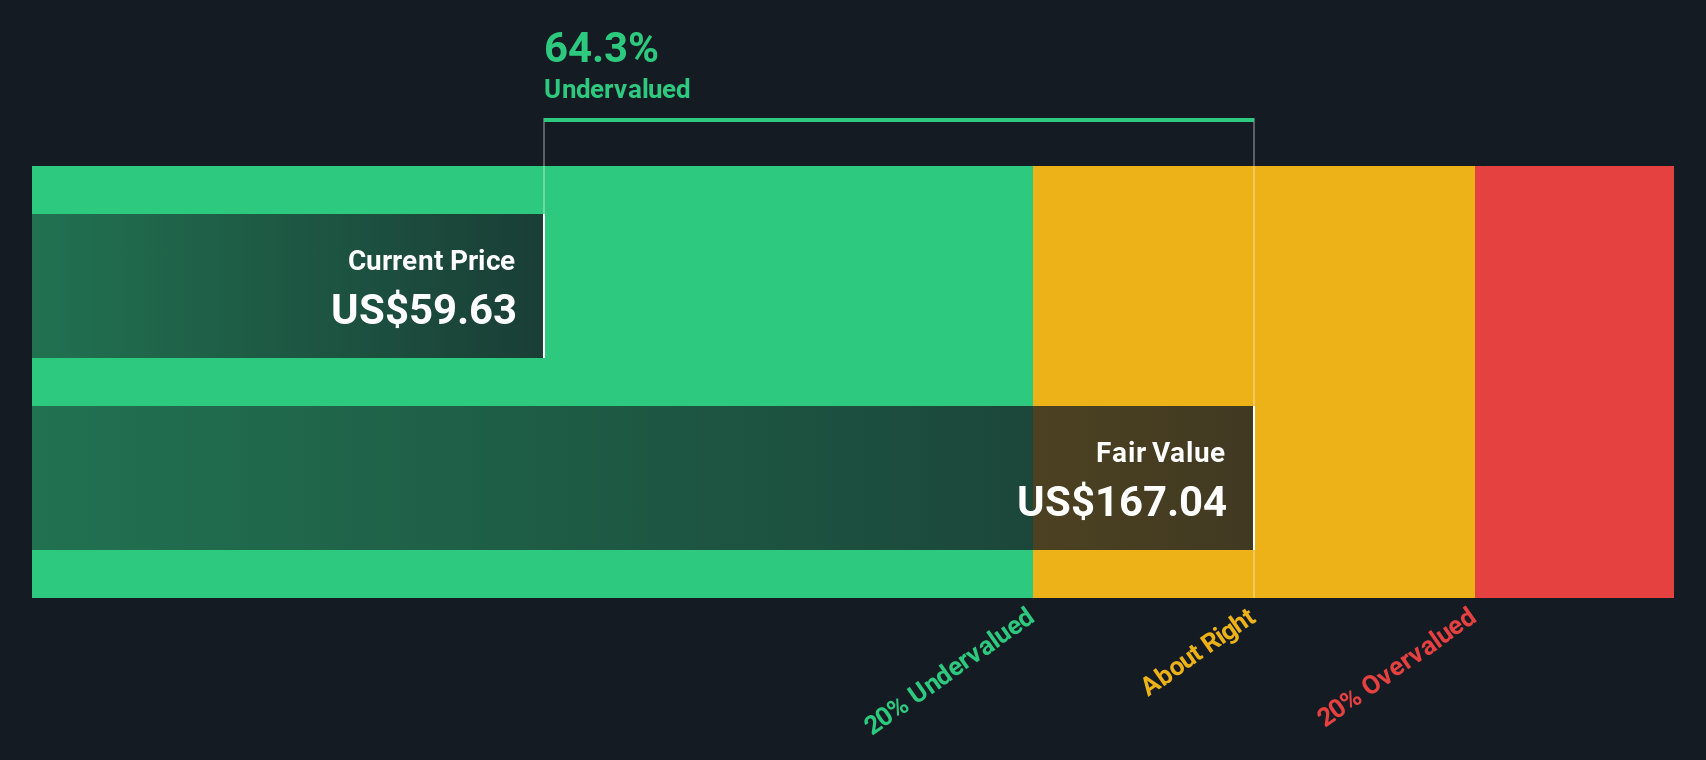
When these DKK cash flows are discounted back using the model assumptions, the estimated intrinsic value comes out at US$153.33 per share. Against the recent share price of US$55.11, the DCF output suggests the stock trades at a 64.1% discount to this intrinsic value, which indicates a materially undervalued reading based on this method alone.
Result: UNDERVALUED
Our Discounted Cash Flow (DCF) analysis suggests Novo Nordisk is undervalued by 64.1%. Track this in your watchlist or portfolio, or discover 877 more undervalued stocks based on cash flows.
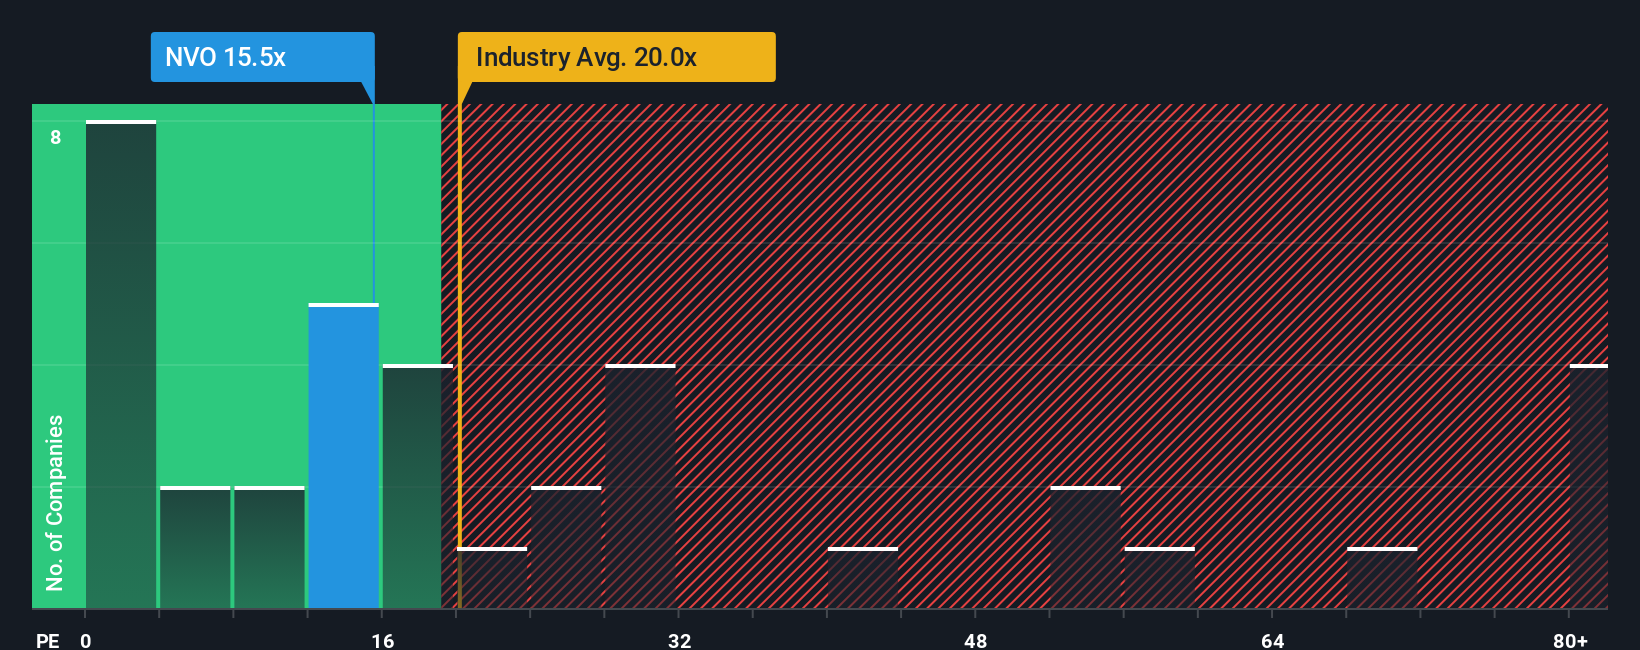
Approach 2: Novo Nordisk Price vs Earnings
For profitable companies like Novo Nordisk, the P/E ratio is a useful way to gauge how much you are paying for each dollar of current earnings. It ties the share price directly to earnings, which many investors focus on when weighing what they get today against what they are willing to pay.
What counts as a “normal” P/E depends on how the market views a company’s growth prospects and risk. Higher expected growth or lower perceived risk can justify a higher multiple, while slower expected growth or higher risk can support a lower one.
Novo Nordisk currently trades on a P/E of 14.85x. This sits below both the Pharmaceuticals industry average P/E of 19.60x and the peer group average of 16.53x. Simply Wall St’s Fair Ratio, a proprietary estimate of what P/E might be reasonable given factors like earnings growth, profit margins, industry, market cap and specific risks, is 30.72x for Novo Nordisk.
The Fair Ratio is more tailored than a simple peer or industry comparison because it adjusts for the company’s own profile rather than assuming it should trade like an average stock. Comparing 30.72x to the current 14.85x suggests Novo Nordisk screens as undervalued on this P/E based approach.
Result: UNDERVALUED
P/E ratios tell one story, but what if the real opportunity lies elsewhere? Discover 1459 companies where insiders are betting big on explosive growth.
Upgrade Your Decision Making: Choose your Novo Nordisk Narrative
Earlier we mentioned that there is an even better way to understand valuation, so let us introduce you to Narratives, which are simply your own story about Novo Nordisk that links what you believe about its future to a clear forecast and a fair value estimate.
On Simply Wall St, Narratives let you spell out your assumptions for revenue, earnings and margins, then translate those into a fair value that you can compare directly with today’s share price to decide whether the gap is large enough to act on or to wait.
Because Narratives live inside the Community page and are used by millions of investors, they are easy to create, share and review, and they automatically refresh when new information such as quarterly results or major news is added to the underlying data.
For example, one Novo Nordisk Narrative on the platform currently estimates fair value at about US$120.72 per ADR while another assigns a much lower number. This spread reflects how different investors can look at the same company, weigh factors like guidance cuts, policy risk and the obesity pipeline differently, and then reach very different conclusions about whether the current price looks attractive or not.
Do you think there's more to the story for Novo Nordisk? Head over to our Community to see what others are saying!

This article by Simply Wall St is general in nature. We provide commentary based on historical data and analyst forecasts only using an unbiased methodology and our articles are not intended to be financial advice. It does not constitute a recommendation to buy or sell any stock, and does not take account of your objectives, or your financial situation. We aim to bring you long-term focused analysis driven by fundamental data. Note that our analysis may not factor in the latest price-sensitive company announcements or qualitative material. Simply Wall St has no position in any stocks mentioned.
Have feedback on this article? Concerned about the content? Get in touch with us directly. Alternatively, email editorial-team@simplywallst.com