
Assessing AST SpaceMobile (ASTS) Valuation After BlueBird 6 Launch And BlueBird 7 Progress
AST SpaceMobile (ASTS) is back in focus after the successful orbital launch of its BlueBird 6 satellite and the subsequent arrival of BlueBird 7 in Florida for launch vehicle integration.
See our latest analysis for AST SpaceMobile.
The recent surge in excitement around BlueBird 6 and BlueBird 7 has coincided with strong momentum in AST SpaceMobile shares, with a 30 day share price return of 23.0% and a 1 year total shareholder return of 295.3%. Multi year total shareholder return is also very large, which signals that expectations around growth potential and execution on its space based cellular roadmap remain a key driver.
If developments like BlueBird 6 and 7 have your attention, this can be a good moment to widen your watchlist and check out aerospace and defense stocks.
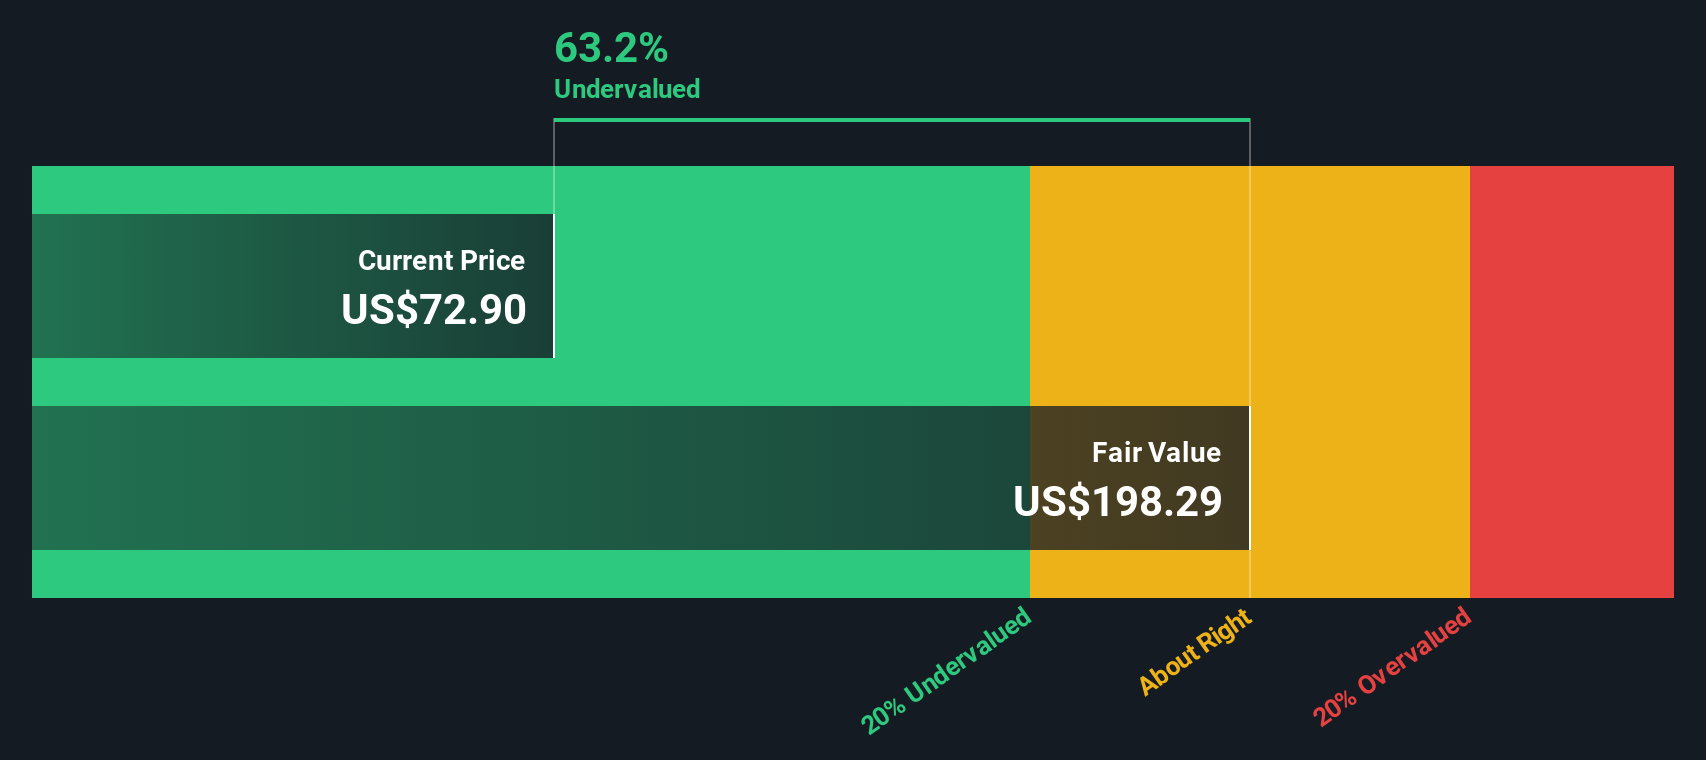
With AST SpaceMobile now reporting an intrinsic value estimate below its recent US$90.92 close and a value score of 1, you have to ask: is the recent excitement over BlueBird already reflected in the price, or is the market still underestimating future growth?
Price to Book of 20.6x, is it justified?
AST SpaceMobile trades on a P/B of 20.6x, which sits well above peers even after the recent share price strength and DCF implied discount.
P/B compares the company’s market value with the book value of its net assets, which can be a useful yardstick for capital intensive or asset heavy businesses in telecom and satellite communications.
Here, the SWS DCF model suggests AST SpaceMobile is trading 11.1% below an estimated fair value of US$102.27. However, the 20.6x P/B is far higher than the peer average of 6.4x and the wider US Telecom industry average of 1.1x. That gap indicates investors are paying a substantial premium to the sector for AST SpaceMobile’s balance sheet.
Compared with peers, the premium is stark. AST SpaceMobile’s 20.6x P/B multiple is more than three times above the immediate peer group and far above the broader telecom industry.
See what the numbers say about this price — find out in our valuation breakdown.
Result: Price-to-book of 20.6x (OVERVALUED)
However, you are still relying on a company with US$18.531 in revenue and a US$303.831 loss, in a space-based model that must prove commercial traction.
Find out about the key risks to this AST SpaceMobile narrative.
Another view on value
The SWS DCF model presents a different picture compared with the rich 20.6x P/B. On this view, AST SpaceMobile’s recent US$90.92 close sits about 11.1% below an estimated fair value of US$102.27, which frames the stock as slightly undervalued rather than stretched.
DCF weighs future cash flow expectations instead of today’s balance sheet premium, so the question for you is straightforward: do you trust the growth forecasts enough to rely on this fair value, or does the lofty P/B keep you cautious?
Look into how the SWS DCF model arrives at its fair value.
Simply Wall St performs a discounted cash flow (DCF) on every stock in the world every day (check out AST SpaceMobile for example). We show the entire calculation in full. You can track the result in your watchlist or portfolio and be alerted when this changes, or use our stock screener to discover 877 undervalued stocks based on their cash flows. If you save a screener we even alert you when new companies match - so you never miss a potential opportunity.
Build Your Own AST SpaceMobile Narrative
If you see the numbers differently or prefer to rely on your own work, you can build a fresh AST SpaceMobile story in just a few minutes: Do it your way.
A great starting point for your AST SpaceMobile research is our analysis highlighting 2 key rewards and 3 important warning signs that could impact your investment decision.
Looking for more investment ideas?
If AST SpaceMobile is on your radar, it makes sense to widen the lens and hunt for other opportunities that could round out your watchlist and portfolio.
- Spot potential value candidates fast by scanning these 877 undervalued stocks based on cash flows that line up with your own expectations on cash flow and pricing.
- Ride the AI wave more thoughtfully by checking these 25 AI penny stocks that link real business models with artificial intelligence themes.
- Strengthen your income stream by filtering for these 14 dividend stocks with yields > 3% that might fit a yield focused investing style.
This article by Simply Wall St is general in nature. We provide commentary based on historical data and analyst forecasts only using an unbiased methodology and our articles are not intended to be financial advice. It does not constitute a recommendation to buy or sell any stock, and does not take account of your objectives, or your financial situation. We aim to bring you long-term focused analysis driven by fundamental data. Note that our analysis may not factor in the latest price-sensitive company announcements or qualitative material. Simply Wall St has no position in any stocks mentioned.
Have feedback on this article? Concerned about the content? Get in touch with us directly. Alternatively, email editorial-team@simplywallst.com