
- PREMIUM
- LIVE QUOTES
- INSTITUTIONS
 Index Options
 State Street
 CME Group
 Nasdaq
 Cboe
Cboe TradingView
 Wall Street Journal
A Look At The Intrinsic Value Of Unitronics (1989) (R"G) Ltd (TLV:UNIT)
Key Insights
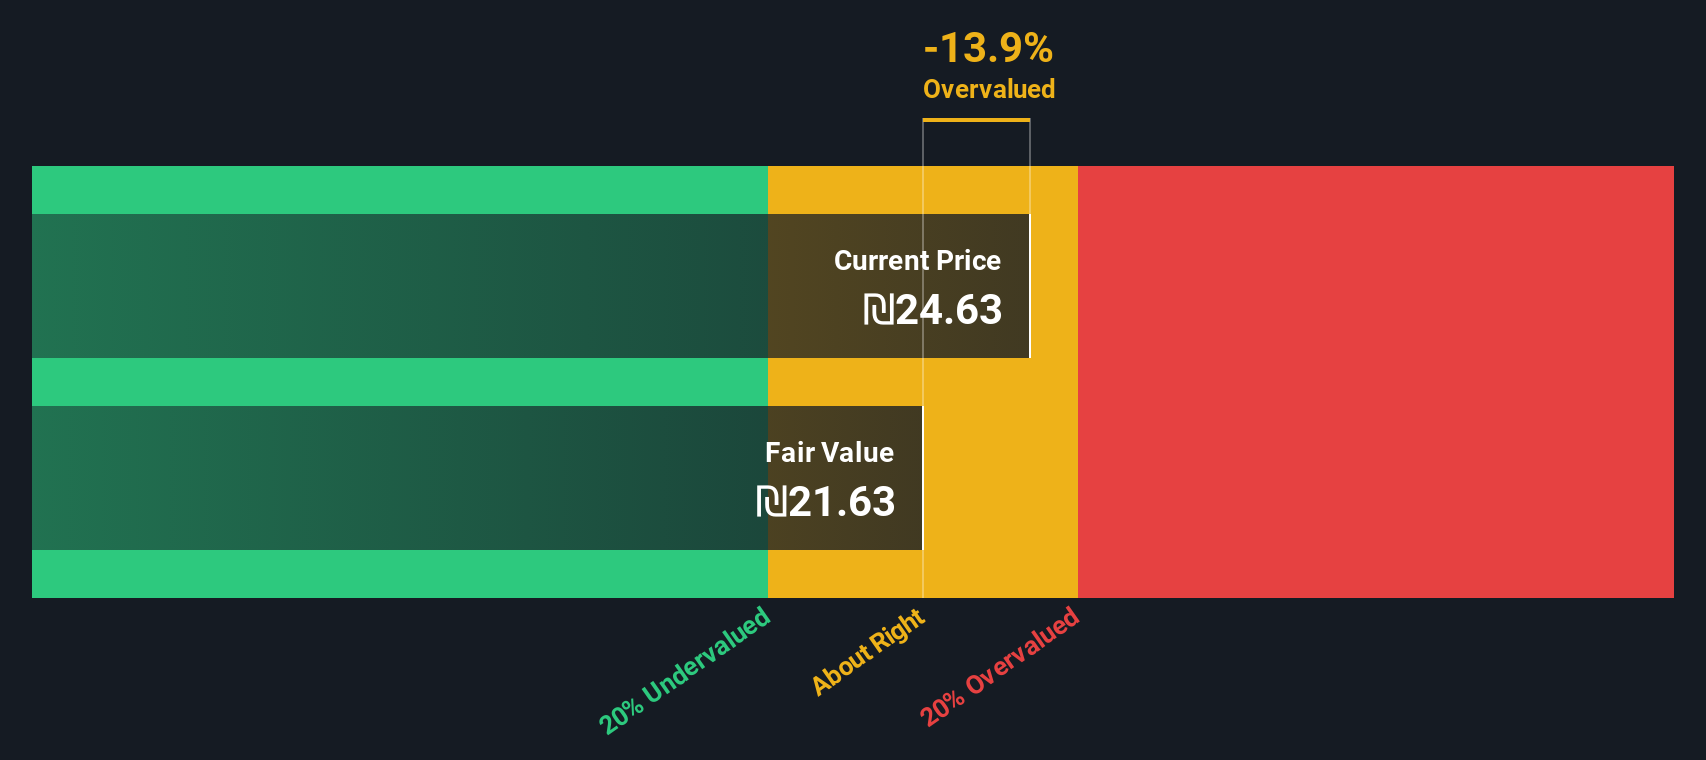
- Unitronics (1989) (RG)'s estimated fair value is ₪21.63 based on 2 Stage Free Cash Flow to Equity
- With ₪24.63 share price, Unitronics (1989) (RG) appears to be trading close to its estimated fair value
- When compared to theindustry average discount of -40%, Unitronics (1989) (RG)'s competitors seem to be trading at a greater premium to fair value
In this article we are going to estimate the intrinsic value of Unitronics (1989) (R"G) Ltd (TLV:UNIT) by taking the forecast future cash flows of the company and discounting them back to today's value. Our analysis will employ the Discounted Cash Flow (DCF) model. It may sound complicated, but actually it is quite simple!
Remember though, that there are many ways to estimate a company's value, and a DCF is just one method. If you want to learn more about discounted cash flow, the rationale behind this calculation can be read in detail in the Simply Wall St analysis model.
The Model
We're using the 2-stage growth model, which simply means we take in account two stages of company's growth. In the initial period the company may have a higher growth rate and the second stage is usually assumed to have a stable growth rate. To start off with, we need to estimate the next ten years of cash flows. Seeing as no analyst estimates of free cash flow are available to us, we have extrapolate the previous free cash flow (FCF) from the company's last reported value. We assume companies with shrinking free cash flow will slow their rate of shrinkage, and that companies with growing free cash flow will see their growth rate slow, over this period. We do this to reflect that growth tends to slow more in the early years than it does in later years.
A DCF is all about the idea that a dollar in the future is less valuable than a dollar today, so we need to discount the sum of these future cash flows to arrive at a present value estimate:
10-year free cash flow (FCF) estimate
| 2026 | 2027 | 2028 | 2029 | 2030 | 2031 | 2032 | 2033 | 2034 | 2035 | |
| Levered FCF (₪, Millions) | ₪26.1m | ₪25.5m | ₪25.3m | ₪25.5m | ₪25.8m | ₪26.3m | ₪26.9m | ₪27.6m | ₪28.3m | ₪29.1m |
| Growth Rate Estimate Source | Est @ -4.52% | Est @ -2.21% | Est @ -0.60% | Est @ 0.53% | Est @ 1.32% | Est @ 1.87% | Est @ 2.26% | Est @ 2.53% | Est @ 2.72% | Est @ 2.85% |
| Present Value (₪, Millions) Discounted @ 11% | ₪23.5 | ₪20.8 | ₪18.7 | ₪17.0 | ₪15.5 | ₪14.3 | ₪13.2 | ₪12.3 | ₪11.4 | ₪10.6 |
("Est" = FCF growth rate estimated by Simply Wall St)
Present Value of 10-year Cash Flow (PVCF) = ₪157m
We now need to calculate the Terminal Value, which accounts for all the future cash flows after this ten year period. The Gordon Growth formula is used to calculate Terminal Value at a future annual growth rate equal to the 5-year average of the 10-year government bond yield of 3.2%. We discount the terminal cash flows to today's value at a cost of equity of 11%.
Terminal Value (TV)= FCF2035 × (1 + g) ÷ (r – g) = ₪29m× (1 + 3.2%) ÷ (11%– 3.2%) = ₪400m
Present Value of Terminal Value (PVTV)= TV / (1 + r)10= ₪400m÷ ( 1 + 11%)10= ₪145m
The total value, or equity value, is then the sum of the present value of the future cash flows, which in this case is ₪303m. To get the intrinsic value per share, we divide this by the total number of shares outstanding. Relative to the current share price of ₪24.6, the company appears around fair value at the time of writing. Valuations are imprecise instruments though, rather like a telescope - move a few degrees and end up in a different galaxy. Do keep this in mind.
The Assumptions
Now the most important inputs to a discounted cash flow are the discount rate, and of course, the actual cash flows. You don't have to agree with these inputs, I recommend redoing the calculations yourself and playing with them. The DCF also does not consider the possible cyclicality of an industry, or a company's future capital requirements, so it does not give a full picture of a company's potential performance. Given that we are looking at Unitronics (1989) (RG) as potential shareholders, the cost of equity is used as the discount rate, rather than the cost of capital (or weighted average cost of capital, WACC) which accounts for debt. In this calculation we've used 11%, which is based on a levered beta of 1.141. Beta is a measure of a stock's volatility, compared to the market as a whole. We get our beta from the industry average beta of globally comparable companies, with an imposed limit between 0.8 and 2.0, which is a reasonable range for a stable business.
See our latest analysis for Unitronics (1989) (RG)
SWOT Analysis for Unitronics (1989) (RG)
- Debt is not viewed as a risk.
- Dividend is in the top 25% of dividend payers in the market.
- Earnings declined over the past year.
- Current share price is above our estimate of fair value.
- UNIT's financial characteristics indicate limited near-term opportunities for shareholders.
- Lack of analyst coverage makes it difficult to determine UNIT's earnings prospects.
- Dividends are not covered by earnings and cashflows.
Moving On:
Valuation is only one side of the coin in terms of building your investment thesis, and it ideally won't be the sole piece of analysis you scrutinize for a company. It's not possible to obtain a foolproof valuation with a DCF model. Instead the best use for a DCF model is to test certain assumptions and theories to see if they would lead to the company being undervalued or overvalued. For instance, if the terminal value growth rate is adjusted slightly, it can dramatically alter the overall result. For Unitronics (1989) (RG), we've put together three pertinent factors you should explore:
- Risks: For example, we've discovered 1 warning sign for Unitronics (1989) (RG) that you should be aware of before investing here.
- Other Solid Businesses: Low debt, high returns on equity and good past performance are fundamental to a strong business. Why not explore our interactive list of stocks with solid business fundamentals to see if there are other companies you may not have considered!
- Other Top Analyst Picks: Interested to see what the analysts are thinking? Take a look at our interactive list of analysts' top stock picks to find out what they feel might have an attractive future outlook!
PS. The Simply Wall St app conducts a discounted cash flow valuation for every stock on the TASE every day. If you want to find the calculation for other stocks just search here.
Have feedback on this article? Concerned about the content? Get in touch with us directly. Alternatively, email editorial-team (at) simplywallst.com.
This article by Simply Wall St is general in nature. We provide commentary based on historical data and analyst forecasts only using an unbiased methodology and our articles are not intended to be financial advice. It does not constitute a recommendation to buy or sell any stock, and does not take account of your objectives, or your financial situation. We aim to bring you long-term focused analysis driven by fundamental data. Note that our analysis may not factor in the latest price-sensitive company announcements or qualitative material. Simply Wall St has no position in any stocks mentioned.