
- PREMIUM
- LIVE QUOTES
- INSTITUTIONS
 Index Options
 State Street
 CME Group
 Nasdaq
 Cboe
Cboe TradingView
 Wall Street Journal
Is It Too Late To Consider Oracle (ORCL) After The Recent Share Price Pullback
- If you are wondering whether Oracle's current share price still offers value or if most of the opportunity is already priced in, this article will help you frame that question clearly before you commit fresh capital.
- Oracle's stock sits at US$192.59 after a 2.3% decline over the last 7 days and an 11.5% decline over the last 30 days, while the shares have returned 20.0% over 1 year, 130.2% over 3 years and 229.5% over 5 years.
- Recent attention on Oracle has been shaped by its role in large scale enterprise software and cloud infrastructure, with investors closely watching how these businesses influence sentiment around the stock. This context helps explain why short term pullbacks can sit alongside stronger multi year returns.
- On our 6 point valuation checklist, Oracle scores a 2 out of 6, which suggests only some of the usual valuation signals line up. In the next sections, we will compare different valuation methods and then finish with a framework that can help you interpret those numbers in a more complete way.
Oracle scores just 2/6 on our valuation checks. See what other red flags we found in the full valuation breakdown.
Approach 1: Oracle Discounted Cash Flow (DCF) Analysis
A Discounted Cash Flow, or DCF, model takes forecasts of a company’s future cash flows and discounts them back to today’s dollars, aiming to estimate what the entire business might be worth right now.
For Oracle, the model used is a 2 Stage Free Cash Flow to Equity approach, based on cash flow projections in $. The latest twelve month free cash flow is reported at about $2.94b. Analysts provide explicit estimates for several years, and Simply Wall St extends this with its own projections. This reaches a forecast free cash flow of about $22.71b in 2030, with further years extrapolated from that path.
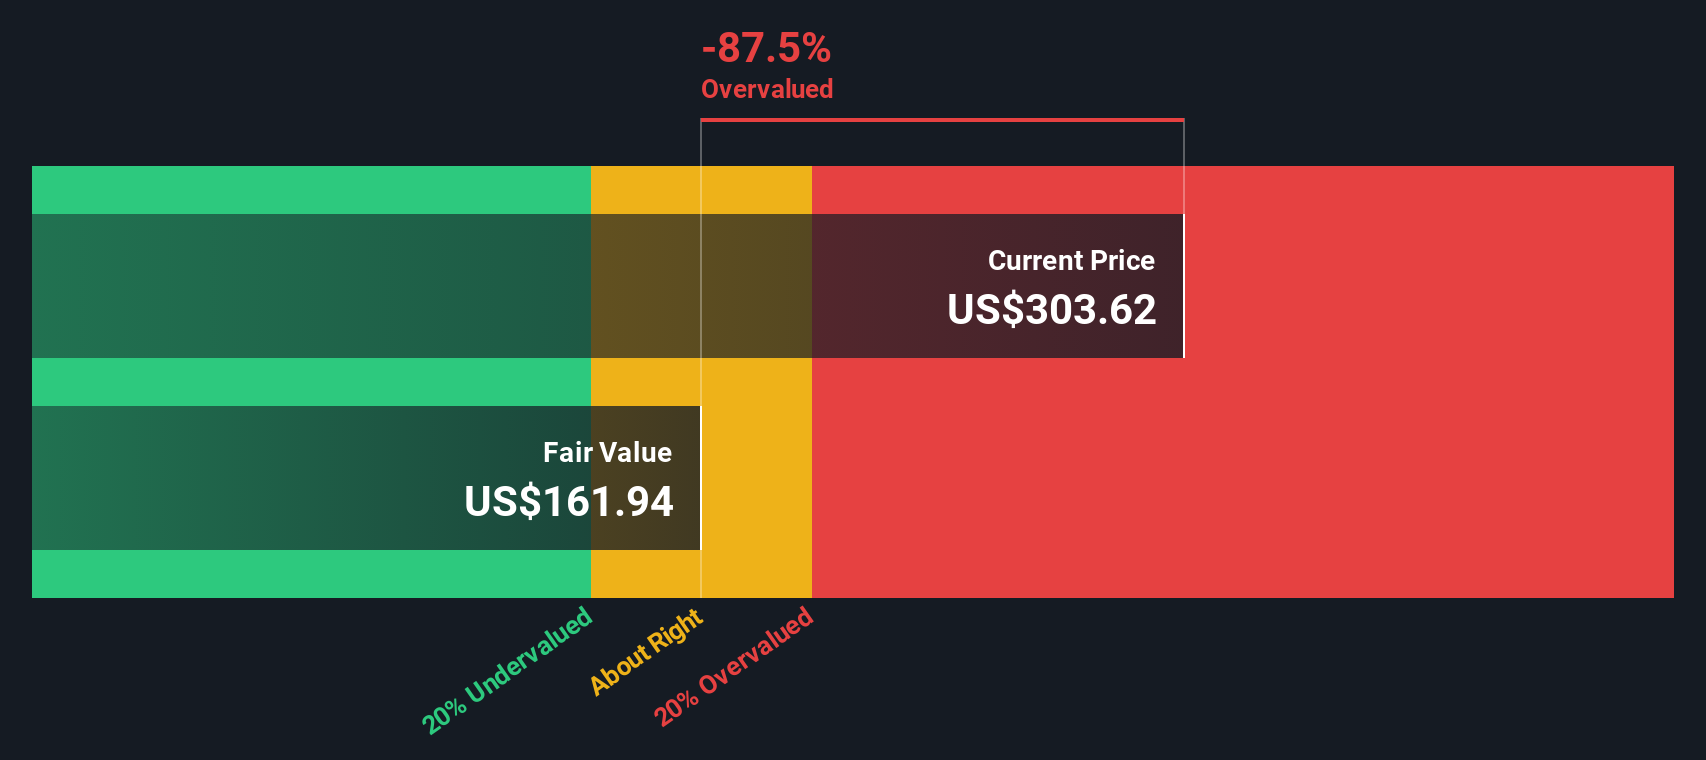
After discounting these projected cash flows back to today, the model arrives at an estimated intrinsic value of $165.47 per share for Oracle. With the current share price at $192.59, the DCF output implies the stock is about 16.4% above this estimate, so on this model Oracle screens as overvalued rather than cheap.
Result: OVERVALUED
Our Discounted Cash Flow (DCF) analysis suggests Oracle may be overvalued by 16.4%. Discover 877 undervalued stocks or create your own screener to find better value opportunities.
Approach 2: Oracle Price vs Earnings
For a profitable company like Oracle, the P/E ratio is a useful yardstick because it connects what you pay for each share with the earnings that support that price. In practice, investors tend to accept a higher or lower P/E depending on what they expect for future growth and how risky they think those earnings are.
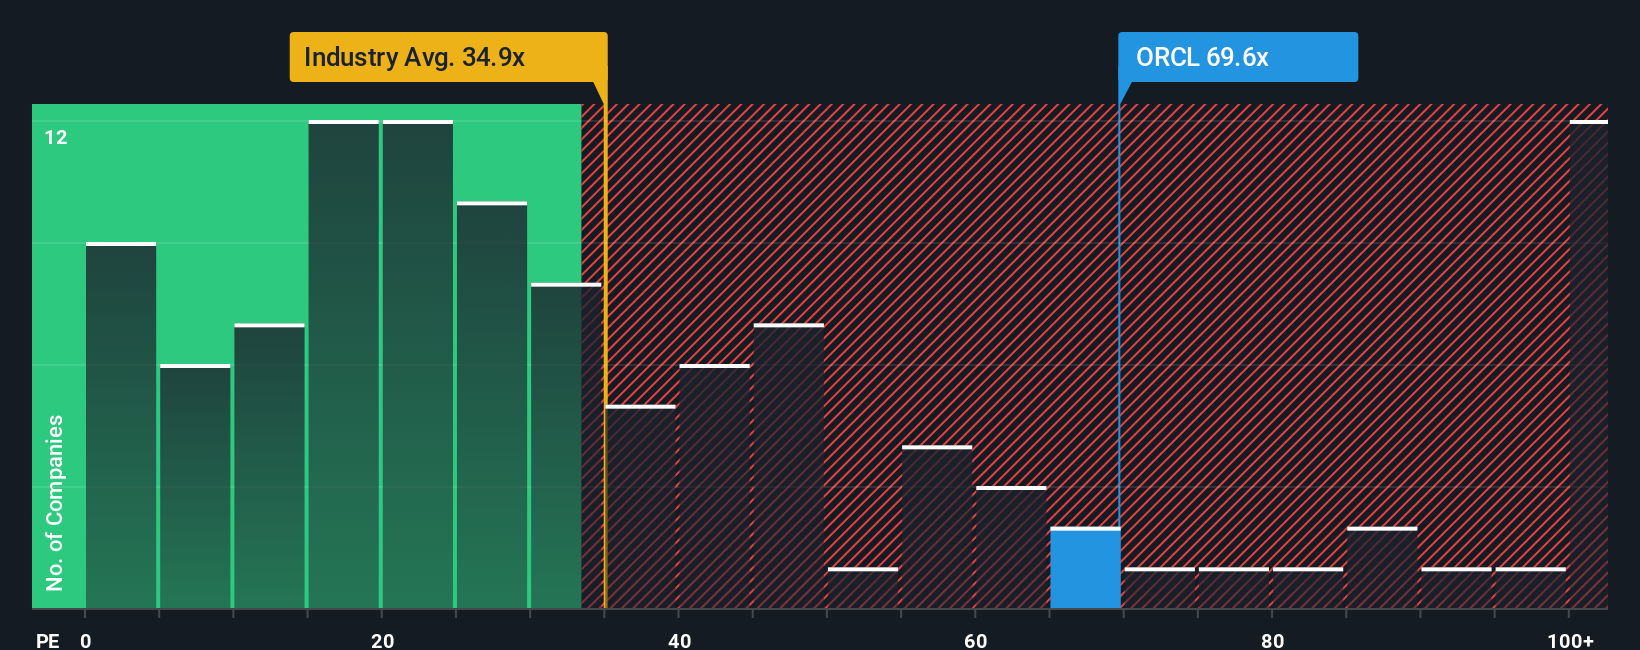
Oracle’s current P/E is about 35.9x. That compares with an average of about 31.7x for the broader Software industry and a peer group average of about 66.6x, so Oracle sits above the industry level but well below some peers. Simply Wall St also calculates a “Fair Ratio” for Oracle of about 54.8x. This is a proprietary P/E estimate that factors in elements such as the company’s earnings profile, industry, profit margins, market cap and risk characteristics.
Because the Fair Ratio is tailored to Oracle’s own fundamentals, it can be more informative than a simple comparison with broad industry or peer averages. Setting that 54.8x Fair Ratio against the current 35.9x P/E suggests the shares trade below what this model would imply.
Result: UNDERVALUED
P/E ratios tell one story, but what if the real opportunity lies elsewhere? Discover 1459 companies where insiders are betting big on explosive growth.
Upgrade Your Decision Making: Choose your Oracle Narrative
Earlier we mentioned that there is an even better way to understand valuation, so let us introduce you to Narratives, which are simply your story about a company, linked to your assumptions for future revenue, earnings and margins, that then feed into a financial forecast and a Fair Value you can easily compare with today’s share price.
On Simply Wall St’s Community page, Narratives give you a straightforward place to set out your view of Oracle, plug in your estimates, see the implied Fair Value, and then decide whether the current price looks high or low relative to that story, without needing to build a spreadsheet.
Narratives also stay current, because when fresh information such as news or earnings arrives, the underlying data and Fair Values are updated, so your story and its numbers do not go stale as the market responds to new developments.
For example, one Oracle Narrative on the platform currently applies a Fair Value of about US$389.81 per share. Another applies about US$342.28. This shows how two investors looking at the same company can reasonably arrive at very different conclusions once they spell out their assumptions and compare those Fair Values with the live price.
Do you think there's more to the story for Oracle? Head over to our Community to see what others are saying!

This article by Simply Wall St is general in nature. We provide commentary based on historical data and analyst forecasts only using an unbiased methodology and our articles are not intended to be financial advice. It does not constitute a recommendation to buy or sell any stock, and does not take account of your objectives, or your financial situation. We aim to bring you long-term focused analysis driven by fundamental data. Note that our analysis may not factor in the latest price-sensitive company announcements or qualitative material. Simply Wall St has no position in any stocks mentioned.
Have feedback on this article? Concerned about the content? Get in touch with us directly. Alternatively, email editorial-team@simplywallst.com