
- PREMIUM
- LIVE QUOTES
- INSTITUTIONS
 Index Options
 State Street
 CME Group
 Nasdaq
 Cboe
Cboe TradingView
 Wall Street Journal
Assessing Unum Group (UNM) Valuation After Recent Share Price Momentum And DCF Undervaluation Estimate
Unum Group (UNM) has come onto investors’ radar after its recent share performance, with the stock around $78.31 and a value score of 4. This has prompted fresh attention to this insurance provider’s fundamentals.
See our latest analysis for Unum Group.
At around $78.31, Unum Group’s recent share price movement includes a 5.41% 1 month share price return and a 9.18% 1 year total shareholder return, indicating measured momentum following a very large 5 year total shareholder return multiple.
If this kind of long run compounding interests you, it could be a good moment to broaden your watchlist with fast growing stocks with high insider ownership.
With a value score of 4, an indicated intrinsic discount around 54% and analyst targets sitting above the current US$78.31 share price, the key question is whether Unum is still mispriced or if the market already reflects its future growth.
Most Popular Narrative Narrative: 15.9% Undervalued
The most followed narrative puts Unum Group’s fair value at about US$93.08 per share, compared with the recent US$78.31 price, and ties that gap to very specific expectations for revenues, earnings and valuation multiples over the next few years.
The expanding focus among employers on employee and voluntary benefits, along with increasing awareness of supplemental products driven by a competitive labor market, is allowing Unum to cross-sell more solutions and penetrate new market segments, underpinning premium and recurring revenue growth.
Curious what sits behind that valuation gap? The narrative leans on steady premium growth, modest margin shifts and a future earnings multiple that does not match typical sector assumptions. Want to see how those moving parts add up to its fair value?
Result: Fair Value of $93.08 (UNDERVALUED)
Have a read of the narrative in full and understand what's behind the forecasts.
However, this story can change quickly if benefit ratios stay elevated or long term care challenges persist, putting pressure on earnings and the current valuation case.
Find out about the key risks to this Unum Group narrative.
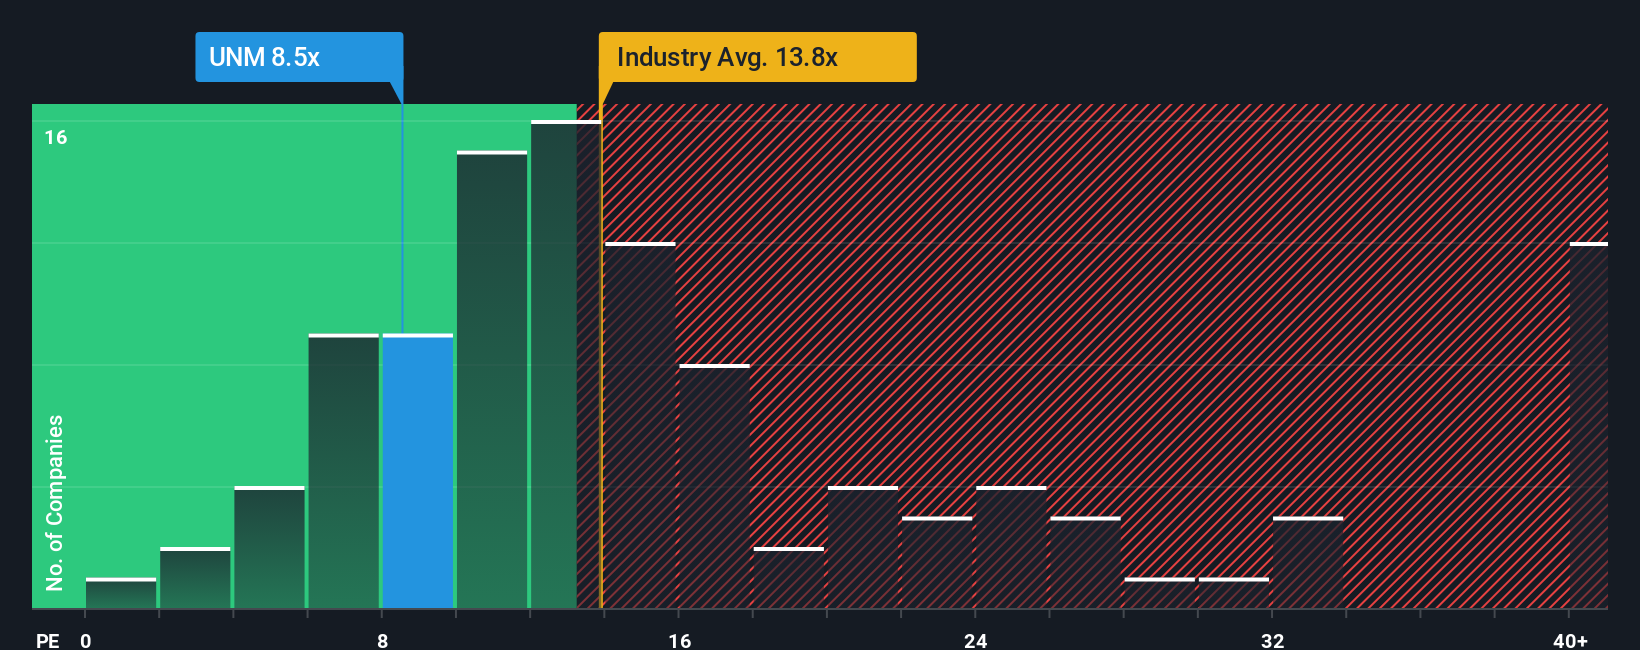
Another Angle: What Earnings Ratios Are Signalling
Our DCF work points to a large valuation gap, but the earnings multiple sends a different message. Unum trades on a P/E of 14.4x, above both the US Insurance sector at 12.9x and peers at 9.6x, yet below our fair ratio of 17.2x. That mix hints at both upside and valuation risk. The key question is which signal investors might find more informative.
See what the numbers say about this price — find out in our valuation breakdown.
Build Your Own Unum Group Narrative
If you see the numbers differently or simply prefer to test your own assumptions, you can build a custom Unum view in minutes with Do it your way.
A great starting point for your Unum Group research is our analysis highlighting 4 key rewards and 2 important warning signs that could impact your investment decision.
Looking for more investment ideas?
If Unum has your attention, do not stop here. Broaden your hunt with focused stock ideas that match the kind of opportunities you actually want to follow.
- Target potential high growth stories early by checking out these 3557 penny stocks with strong financials that combine smaller size with solid underlying metrics.
- Ride the AI wave more deliberately by scanning these 25 AI penny stocks that tie artificial intelligence themes to listed businesses.
- Hunt for mispriced opportunities using these 877 undervalued stocks based on cash flows that highlight companies where the market price sits below estimated cash flow value.
This article by Simply Wall St is general in nature. We provide commentary based on historical data and analyst forecasts only using an unbiased methodology and our articles are not intended to be financial advice. It does not constitute a recommendation to buy or sell any stock, and does not take account of your objectives, or your financial situation. We aim to bring you long-term focused analysis driven by fundamental data. Note that our analysis may not factor in the latest price-sensitive company announcements or qualitative material. Simply Wall St has no position in any stocks mentioned.
Have feedback on this article? Concerned about the content? Get in touch with us directly. Alternatively, email editorial-team@simplywallst.com