
- PREMIUM
- LIVE QUOTES
- INSTITUTIONS
 Index Options
 State Street
 CME Group
 Nasdaq
 Cboe
Cboe TradingView
 Wall Street Journal
Institutional investors are Aspo Oyj's (HEL:ASPO) biggest bettors and were rewarded after last week's €21m market cap gain
Key Insights
- Given the large stake in the stock by institutions, Aspo Oyj's stock price might be vulnerable to their trading decisions
- The top 14 shareholders own 50% of the company
- Recent purchases by insiders
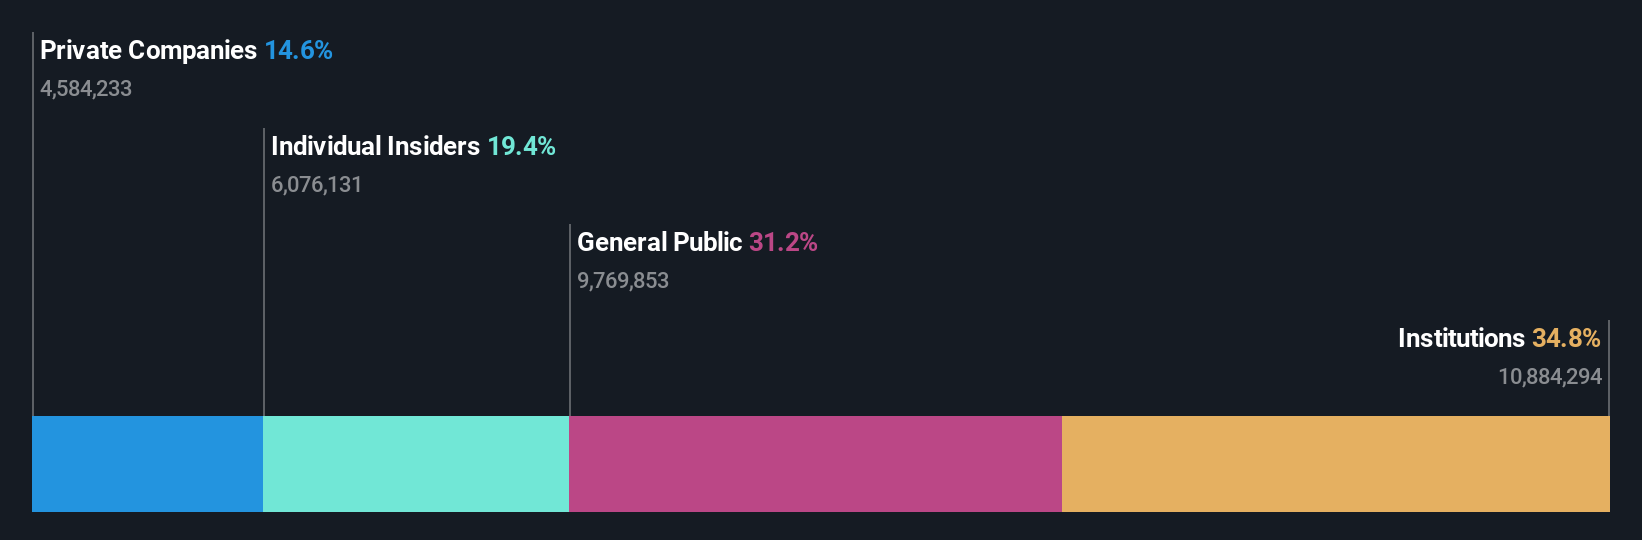
If you want to know who really controls Aspo Oyj (HEL:ASPO), then you'll have to look at the makeup of its share registry. We can see that institutions own the lion's share in the company with 35% ownership. That is, the group stands to benefit the most if the stock rises (or lose the most if there is a downturn).
Last week’s 11% gain means that institutional investors were on the positive end of the spectrum even as the company has shown strong longer-term trends. The one-year return on investment is currently 46% and last week's gain would have been more than welcomed.
In the chart below, we zoom in on the different ownership groups of Aspo Oyj.
See our latest analysis for Aspo Oyj
What Does The Institutional Ownership Tell Us About Aspo Oyj?
Institutions typically measure themselves against a benchmark when reporting to their own investors, so they often become more enthusiastic about a stock once it's included in a major index. We would expect most companies to have some institutions on the register, especially if they are growing.
Aspo Oyj already has institutions on the share registry. Indeed, they own a respectable stake in the company. This suggests some credibility amongst professional investors. But we can't rely on that fact alone since institutions make bad investments sometimes, just like everyone does. It is not uncommon to see a big share price drop if two large institutional investors try to sell out of a stock at the same time. So it is worth checking the past earnings trajectory of Aspo Oyj, (below). Of course, keep in mind that there are other factors to consider, too.

Hedge funds don't have many shares in Aspo Oyj. Our data shows that Havsudden Oy Ab is the largest shareholder with 11% of shares outstanding. For context, the second largest shareholder holds about 10% of the shares outstanding, followed by an ownership of 4.5% by the third-largest shareholder.
Looking at the shareholder registry, we can see that 50% of the ownership is controlled by the top 14 shareholders, meaning that no single shareholder has a majority interest in the ownership.
Researching institutional ownership is a good way to gauge and filter a stock's expected performance. The same can be achieved by studying analyst sentiments. There is a little analyst coverage of the stock, but not much. So there is room for it to gain more coverage.
Insider Ownership Of Aspo Oyj
While the precise definition of an insider can be subjective, almost everyone considers board members to be insiders. Company management run the business, but the CEO will answer to the board, even if he or she is a member of it.
Insider ownership is positive when it signals leadership are thinking like the true owners of the company. However, high insider ownership can also give immense power to a small group within the company. This can be negative in some circumstances.
Our information suggests that insiders maintain a significant holding in Aspo Oyj. It has a market capitalization of just €222m, and insiders have €43m worth of shares in their own names. We would say this shows alignment with shareholders, but it is worth noting that the company is still quite small; some insiders may have founded the business. You can click here to see if those insiders have been buying or selling.
General Public Ownership
With a 31% ownership, the general public, mostly comprising of individual investors, have some degree of sway over Aspo Oyj. This size of ownership, while considerable, may not be enough to change company policy if the decision is not in sync with other large shareholders.
Private Company Ownership
It seems that Private Companies own 15%, of the Aspo Oyj stock. It's hard to draw any conclusions from this fact alone, so its worth looking into who owns those private companies. Sometimes insiders or other related parties have an interest in shares in a public company through a separate private company.
Next Steps:
While it is well worth considering the different groups that own a company, there are other factors that are even more important. Be aware that Aspo Oyj is showing 3 warning signs in our investment analysis , and 2 of those are a bit concerning...
Ultimately the future is most important. You can access this free report on analyst forecasts for the company.
NB: Figures in this article are calculated using data from the last twelve months, which refer to the 12-month period ending on the last date of the month the financial statement is dated. This may not be consistent with full year annual report figures.
Have feedback on this article? Concerned about the content? Get in touch with us directly. Alternatively, email editorial-team (at) simplywallst.com.
This article by Simply Wall St is general in nature. We provide commentary based on historical data and analyst forecasts only using an unbiased methodology and our articles are not intended to be financial advice. It does not constitute a recommendation to buy or sell any stock, and does not take account of your objectives, or your financial situation. We aim to bring you long-term focused analysis driven by fundamental data. Note that our analysis may not factor in the latest price-sensitive company announcements or qualitative material. Simply Wall St has no position in any stocks mentioned.