
- PREMIUM
- LIVE QUOTES
- INSTITUTIONS
 Index Options
 State Street
 CME Group
 Nasdaq
 Cboe
Cboe TradingView
 Wall Street Journal
Is It Too Late To Consider Applied Materials (AMAT) After 159% Three Year Surge?
- If you are wondering whether Applied Materials is still a sensible buy at around US$268.87, the key question is how that price compares with what the business might be worth.
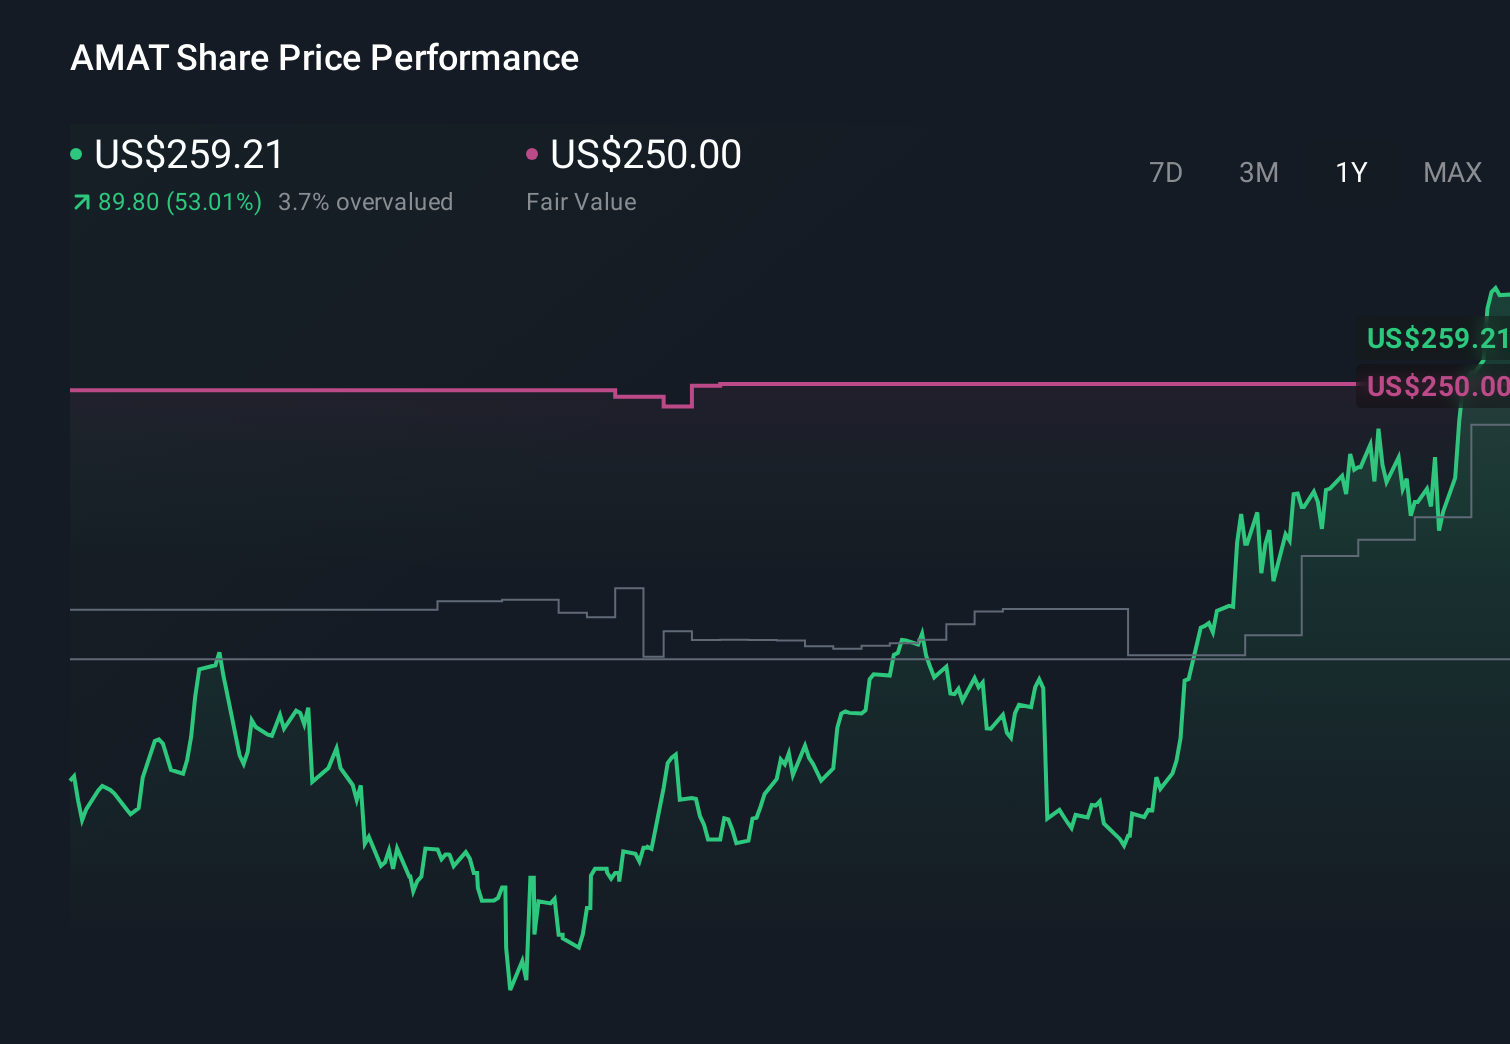
- The stock has returned 2.2% over the last 7 days, 0.3% over the past month, 53.0% over 1 year and 159.4% over 3 years. These moves have clearly changed how some investors think about both its potential and its risks.
- Recent headlines have kept Applied Materials in the spotlight, highlighting its role as a major supplier to chip manufacturers and its exposure to long term semiconductor equipment demand. This context helps explain why the share price has seen strong multi year returns and why investors are paying close attention to what counts as a reasonable valuation today.
- On our checklist of six valuation tests, Applied Materials scores a 3 out of 6. Next we look at how different valuation approaches interpret that score and then finish with a way of thinking about value that can add another layer to your analysis.
Approach 1: Applied Materials Discounted Cash Flow (DCF) Analysis
A Discounted Cash Flow, or DCF, model takes estimates of the cash a company could generate in the future and then discounts those amounts back to what they might be worth in today’s dollars.
For Applied Materials, the model used here is a 2 Stage Free Cash Flow to Equity approach, based on cash flow projections. The latest twelve month free cash flow is about US$6.38b. Analyst inputs and extrapolated estimates suggest projected free cash flows of around US$5.71b in 2026 and US$9.29b by 2030, with further years extended by Simply Wall St beyond the explicit analyst horizon.
When those projected cash flows are discounted back to today, the model arrives at an estimated intrinsic value of about US$139.81 per share. Compared with a current share price of roughly US$268.87, this particular DCF output implies the stock is 92.3% overvalued on these assumptions.
Result: OVERVALUED
Our Discounted Cash Flow (DCF) analysis suggests Applied Materials may be overvalued by 92.3%. Discover 876 undervalued stocks or create your own screener to find better value opportunities.
Approach 2: Applied Materials Price vs Earnings
For profitable companies like Applied Materials, the P/E ratio is a straightforward way to relate what you pay for each share to the earnings that support that price. It helps you see how many dollars investors are currently willing to pay for each dollar of profit.
What counts as a “normal” P/E depends a lot on how the market views a company’s growth potential and risk. Faster expected earnings growth or lower perceived risk can justify a higher multiple, while slower growth or higher uncertainty can justify a lower one.
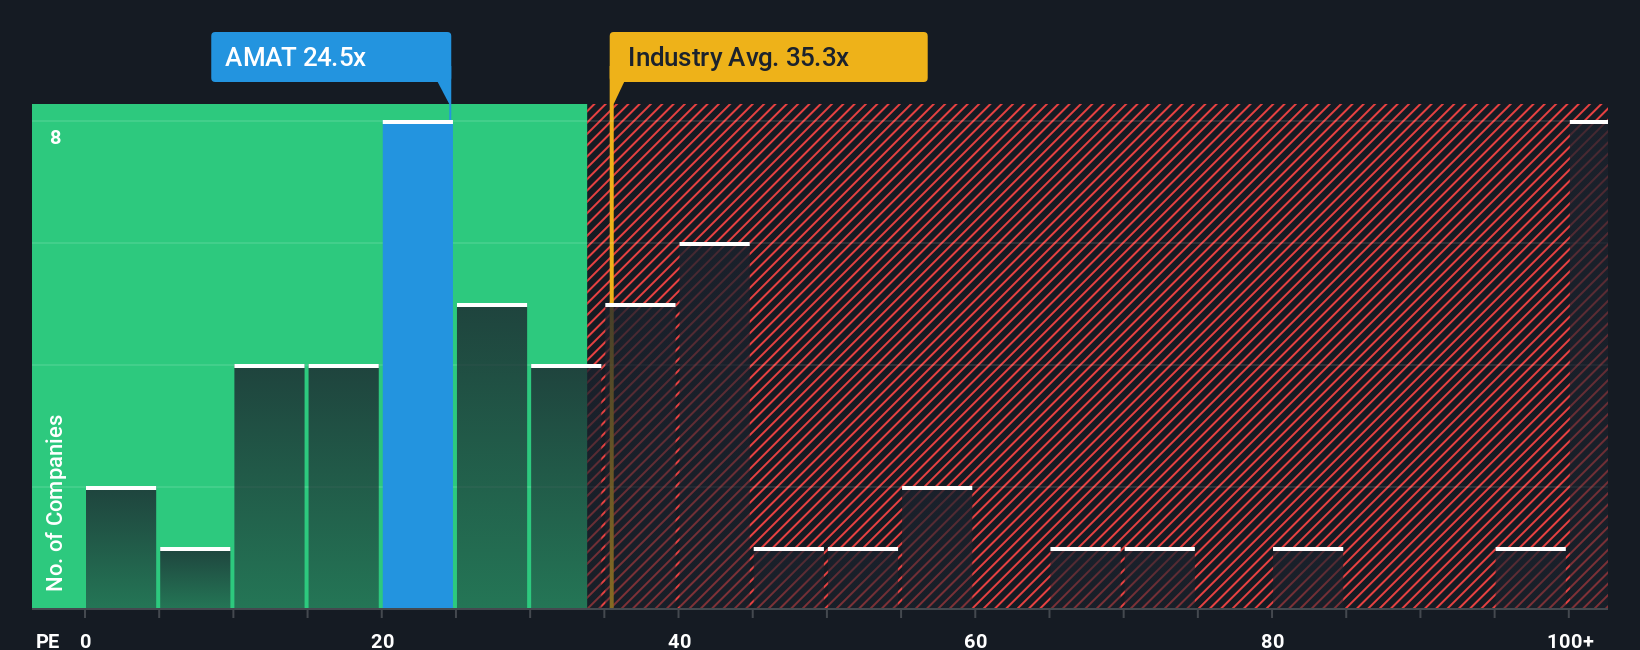
Applied Materials currently trades on a P/E of 30.47x. That sits below the Semiconductor industry average of about 37.31x and the peer average of 44.98x. Simply Wall St’s “Fair Ratio” for the stock is 30.72x. This is its proprietary estimate of an appropriate P/E given factors like earnings growth, profit margins, risks, industry and market cap. This fair value style metric can be more tailored than a simple peer or industry comparison because it attempts to adjust for company specific characteristics rather than assuming all peers deserve similar multiples. With the current P/E of 30.47x very close to the Fair Ratio of 30.72x, the shares appear to be priced at roughly the level implied by these inputs.
Result: ABOUT RIGHT
P/E ratios tell one story, but what if the real opportunity lies elsewhere? Discover 1460 companies where insiders are betting big on explosive growth.
Upgrade Your Decision Making: Choose your Applied Materials Narrative
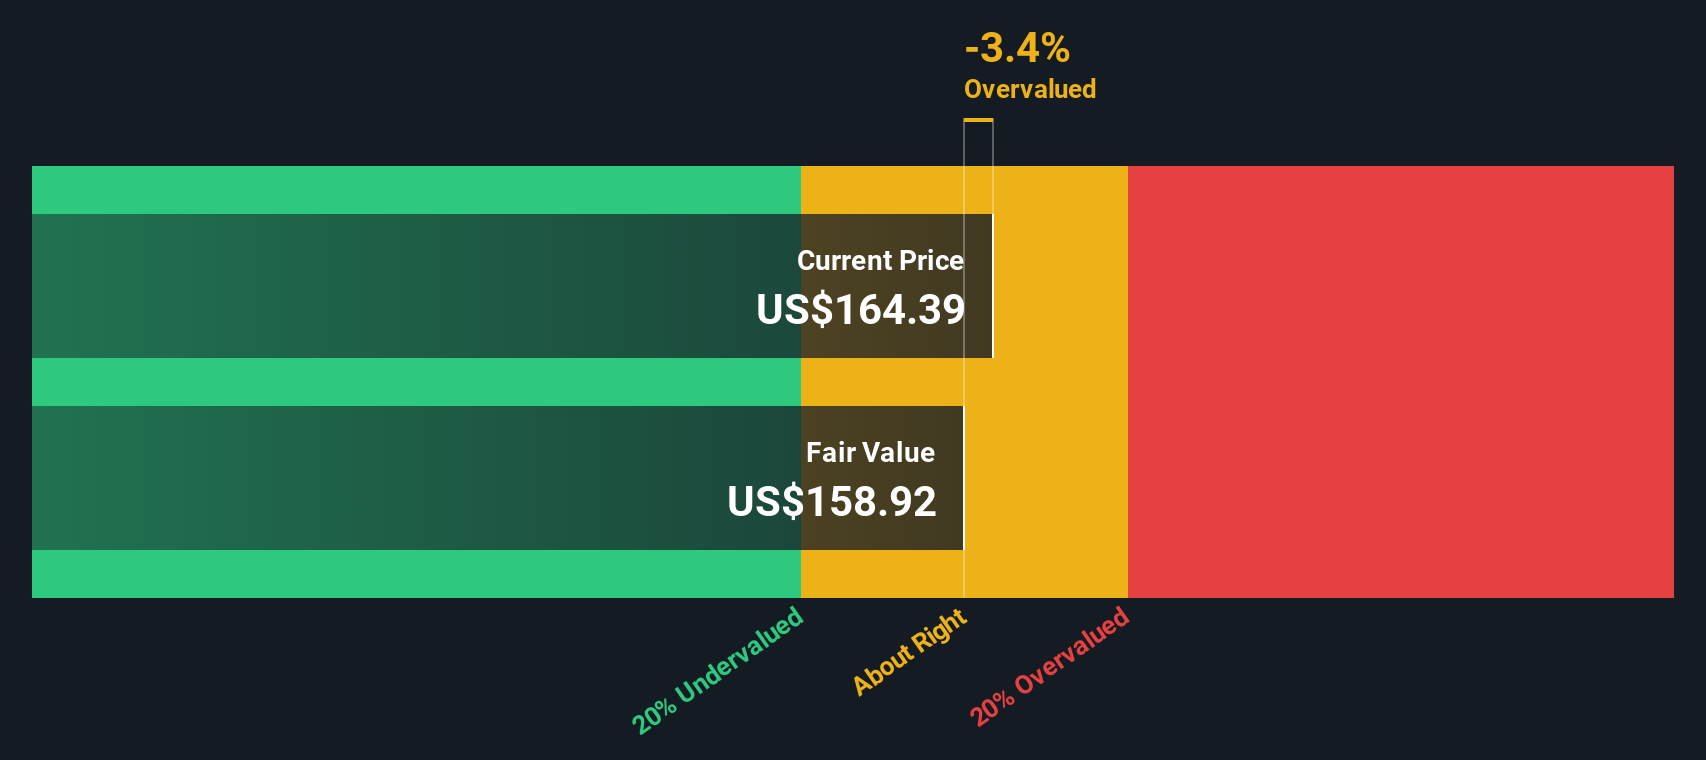
Earlier we mentioned that there is an even better way to understand valuation. Let us introduce you to Narratives, where you set out your story for Applied Materials, link it to your own revenue, earnings and margin assumptions, and let the Simply Wall St Community tool turn that into a fair value. This fair value updates when news or earnings arrive, helps you compare that fair value to the current price to frame potential buy or sell decisions, and lets you see how different perspectives can coexist. For example, one investor might build a cautious view closer to the US$160 analyst low target, while another might lean toward a more optimistic stance nearer the US$248 fair value estimate on the company page. All of this is presented within a simple interface used by millions of investors.
Do you think there's more to the story for Applied Materials? Head over to our Community to see what others are saying!
This article by Simply Wall St is general in nature. We provide commentary based on historical data and analyst forecasts only using an unbiased methodology and our articles are not intended to be financial advice. It does not constitute a recommendation to buy or sell any stock, and does not take account of your objectives, or your financial situation. We aim to bring you long-term focused analysis driven by fundamental data. Note that our analysis may not factor in the latest price-sensitive company announcements or qualitative material. Simply Wall St has no position in any stocks mentioned.
Have feedback on this article? Concerned about the content? Get in touch with us directly. Alternatively, email editorial-team@simplywallst.com