
- PREMIUM
- LIVE QUOTES
- INSTITUTIONS
 Index Options
 State Street
 CME Group
 Nasdaq
 Cboe
Cboe TradingView
 Wall Street Journal
A Look At TBS Holdings (TSE:9401) Valuation After Governance Shock And Executive Resignation
TBS HoldingsInc (TSE:9401) is under governance scrutiny after Managing Director Shigetoshi Ida resigned on December 25, 2025, following internal findings of fraudulent entertainment expense reimbursements and the company’s acknowledgement of a breach of stakeholder trust.
See our latest analysis for TBS HoldingsInc.
At a share price of ¥5,823, TBS HoldingsInc has seen a 5.32% 1 month share price return and an 8.68% 3 month share price return. Its 1 year total shareholder return of 51.23% and very large 3 year total shareholder return of just over 3x suggest momentum has been strong, even as the recent governance issue refocuses attention on risk controls.
If this governance shock has you reassessing media holdings, it could be a good moment to broaden your search with fast growing stocks with high insider ownership.
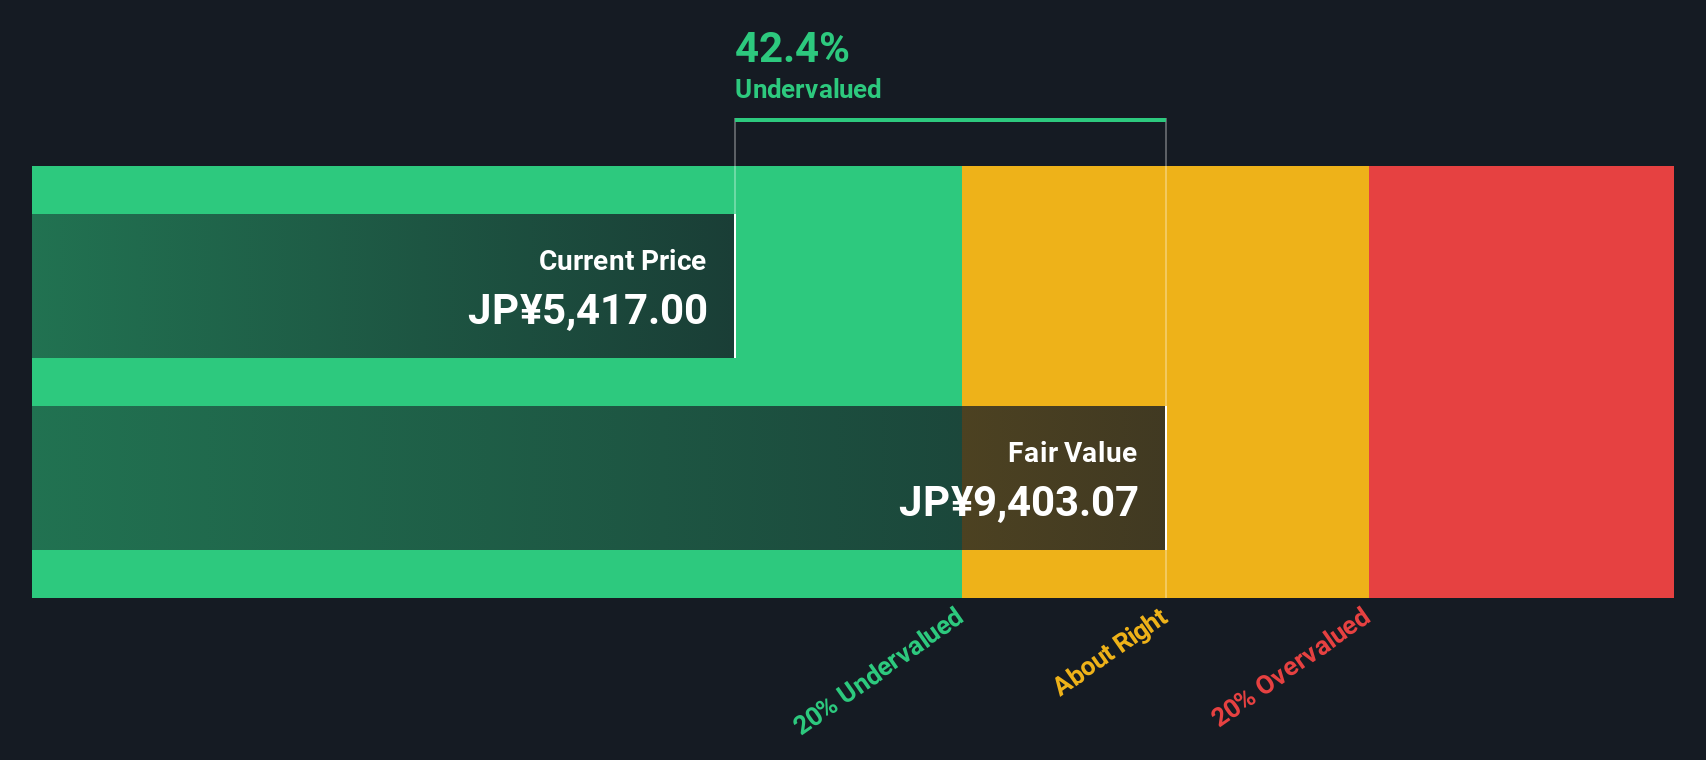
With the shares trading at ¥5,823 and an intrinsic value estimate implying a large discount, while the price sits slightly above the average analyst target, you have to ask: is there real upside here, or is future growth already priced in?
Price-to-Earnings of 16.4x: Is it justified?
TBS HoldingsInc trades on a P/E of 16.4x, and our model suggests the shares offer value even though peers and the media industry are priced differently.
The P/E ratio compares the current share price with earnings per share, so you are effectively seeing how many years of current earnings the market is paying for. For a media and content group like TBS HoldingsInc, this is a common way investors weigh the price against the company’s ability to generate profit today.
Here, the picture is mixed. The SWS fair P/E is 21.1x, which implies the current 16.4x leaves room for the market to move closer to that level. At the same time, TBS HoldingsInc screens as expensive relative to the peer average of 14.5x and in line with the wider JP Media industry at 16.4x, so the market is not offering an obvious discount when you only look at sector peers.
Explore the SWS fair ratio for TBS HoldingsInc
Result: Price-to-Earnings of 16.4x (UNDERVALUED)
However, you still need to weigh governance concerns after the expense scandal, as well as the fact that the share price sits slightly above the average analyst target.
Find out about the key risks to this TBS HoldingsInc narrative.
Another View: What Our DCF Model Suggests
While the P/E of 16.4x points to some value against the fair ratio of 21.1x, our DCF model goes further, with an estimated fair value of ¥12,856.59 versus the current ¥5,823. That gap flags a larger potential mispricing. It also raises a question: are the assumptions behind that cash flow outlook realistic for you?
Look into how the SWS DCF model arrives at its fair value.
Simply Wall St performs a discounted cash flow (DCF) on every stock in the world every day (check out TBS HoldingsInc for example). We show the entire calculation in full. You can track the result in your watchlist or portfolio and be alerted when this changes, or use our stock screener to discover 876 undervalued stocks based on their cash flows. If you save a screener we even alert you when new companies match - so you never miss a potential opportunity.
Build Your Own TBS HoldingsInc Narrative
If you look at these numbers and reach different conclusions, or simply want to test your own view against the data, you can quickly build a personalised thesis in just a few minutes with Do it your way.
A great starting point for your TBS HoldingsInc research is our analysis highlighting 1 key reward and 2 important warning signs that could impact your investment decision.
Ready to widen your opportunity set?
If TBS HoldingsInc is already on your radar, do not stop there. Broaden your watchlist now so you are not chasing ideas after they move.
- Target potential mispricings by scanning these 876 undervalued stocks based on cash flows that may be trading below what their cash flows suggest.
- Ride powerful technology trends early by filtering for these 25 AI penny stocks shaping the future of automation and data intelligence.
- Tap into income ideas by focusing on these 14 dividend stocks with yields > 3% that might suit a yield focused approach.
This article by Simply Wall St is general in nature. We provide commentary based on historical data and analyst forecasts only using an unbiased methodology and our articles are not intended to be financial advice. It does not constitute a recommendation to buy or sell any stock, and does not take account of your objectives, or your financial situation. We aim to bring you long-term focused analysis driven by fundamental data. Note that our analysis may not factor in the latest price-sensitive company announcements or qualitative material. Simply Wall St has no position in any stocks mentioned.
Have feedback on this article? Concerned about the content? Get in touch with us directly. Alternatively, email editorial-team@simplywallst.com