
- PREMIUM
- LIVE QUOTES
- INSTITUTIONS
 Index Options
 State Street
 CME Group
 Nasdaq
 Cboe
Cboe TradingView
 Wall Street Journal
A Look At HA Sustainable Infrastructure Capital (HASI) Valuation After Expanded Energy Transition Funding With KKR
HA Sustainable Infrastructure Capital (HASI) recently expanded its funding capacity for energy transition projects by adding a $500 million commitment to its CarbonCount Holdings 1 vehicle with KKR & Co. and increasing revolving credit commitments by $175 million.
See our latest analysis for HA Sustainable Infrastructure Capital.
Those funding moves come as the share price sits at $31.82, with a 90-day share price return of 3.48% contrasting with a 1-year total shareholder return of 23.05% and a 5-year total shareholder return of a 41.45% loss. This suggests that momentum has improved recently, while long-term holders still sit on sizeable declines.
If this kind of energy transition story has your attention, it may be worth scanning fast growing stocks with high insider ownership for other companies where ownership and growth expectations are both in focus.
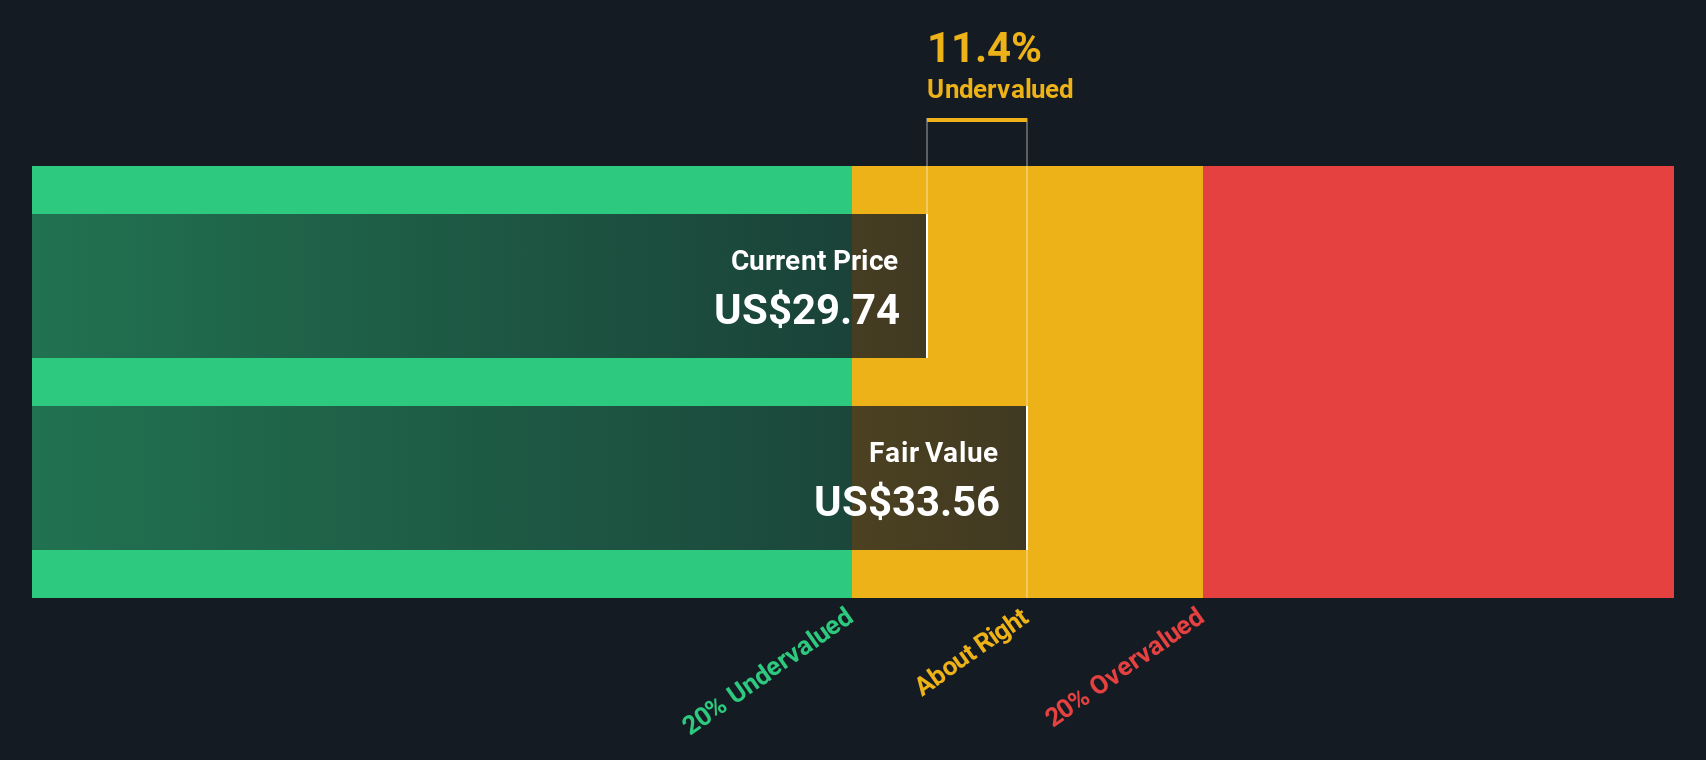
With HA Sustainable Infrastructure Capital trading at $31.82, alongside an indicated 15% intrinsic discount and a 24% gap to analyst targets, the key question is whether this suggests mispricing today or markets already banking on future growth.
Price-to-Earnings of 13.1x: Is it justified?
At a P/E of 13.1x and a last close of $31.82, HA Sustainable Infrastructure Capital screens as undervalued compared with both peers and sector averages.
The P/E ratio compares the share price with earnings per share, so it effectively tells you how many dollars investors are paying for each dollar of current earnings. For a business focused on energy efficiency, renewables, and broader climate solutions, this is a straightforward way to see how the market is pricing its earnings against other diversified financial names.
HASI is described as trading at good value versus peers and the wider US diversified financial industry, with its 13.1x P/E below the 28.2x peer average and slightly below the 13.7x industry average. Against an estimated fair P/E of 14.3x, the current multiple sits under a level the market could reasonably move toward if sentiment and earnings expectations stay aligned with current assessments.
Explore the SWS fair ratio for HA Sustainable Infrastructure Capital
Result: Price-to-Earnings of 13.1x (UNDERVALUED)
However, the 41.45% 5 year total return loss and reliance on continued capital access mean that any slowdown in project activity or financing conditions could quickly challenge that valuation.
Find out about the key risks to this HA Sustainable Infrastructure Capital narrative.
Another View: What Our DCF Model Says
The 13.1x P/E makes HA Sustainable Infrastructure Capital look inexpensive against peers. Our DCF model points in the same direction, with an estimated fair value of $37.61 versus the current $31.82. That 15.4% gap hints at upside. How comfortable are you with the assumptions behind it?
Look into how the SWS DCF model arrives at its fair value.
Simply Wall St performs a discounted cash flow (DCF) on every stock in the world every day (check out HA Sustainable Infrastructure Capital for example). We show the entire calculation in full. You can track the result in your watchlist or portfolio and be alerted when this changes, or use our stock screener to discover 876 undervalued stocks based on their cash flows. If you save a screener we even alert you when new companies match - so you never miss a potential opportunity.
Build Your Own HA Sustainable Infrastructure Capital Narrative
If you look at the numbers and reach a different view, or simply prefer to test your own assumptions, you can build a custom thesis in just a few minutes with Do it your way.
A great starting point for your HA Sustainable Infrastructure Capital research is our analysis highlighting 5 key rewards and 2 important warning signs that could impact your investment decision.
Looking for more investment ideas?
If you are serious about building a stronger portfolio, do not stop at one stock. Use focused screeners to surface other ideas that match your style.
- Hunt for potential turnaround stories by checking out these 3564 penny stocks with strong financials where smaller companies can offer big swings in risk and reward.
- Target the intersection of technology and healthcare by reviewing these 29 healthcare AI stocks that focus on AI driven tools for diagnosis, treatment support, and medical data analysis.
- Focus on income today by searching through these 14 dividend stocks with yields > 3% that pair dividend yields above 3% with the possibility of relatively steadier cash returns.
This article by Simply Wall St is general in nature. We provide commentary based on historical data and analyst forecasts only using an unbiased methodology and our articles are not intended to be financial advice. It does not constitute a recommendation to buy or sell any stock, and does not take account of your objectives, or your financial situation. We aim to bring you long-term focused analysis driven by fundamental data. Note that our analysis may not factor in the latest price-sensitive company announcements or qualitative material. Simply Wall St has no position in any stocks mentioned.
Have feedback on this article? Concerned about the content? Get in touch with us directly. Alternatively, email editorial-team@simplywallst.com