
- PREMIUM
- LIVE QUOTES
- INSTITUTIONS
 Index Options
 State Street
 CME Group
 Nasdaq
 Cboe
Cboe TradingView
 Wall Street Journal
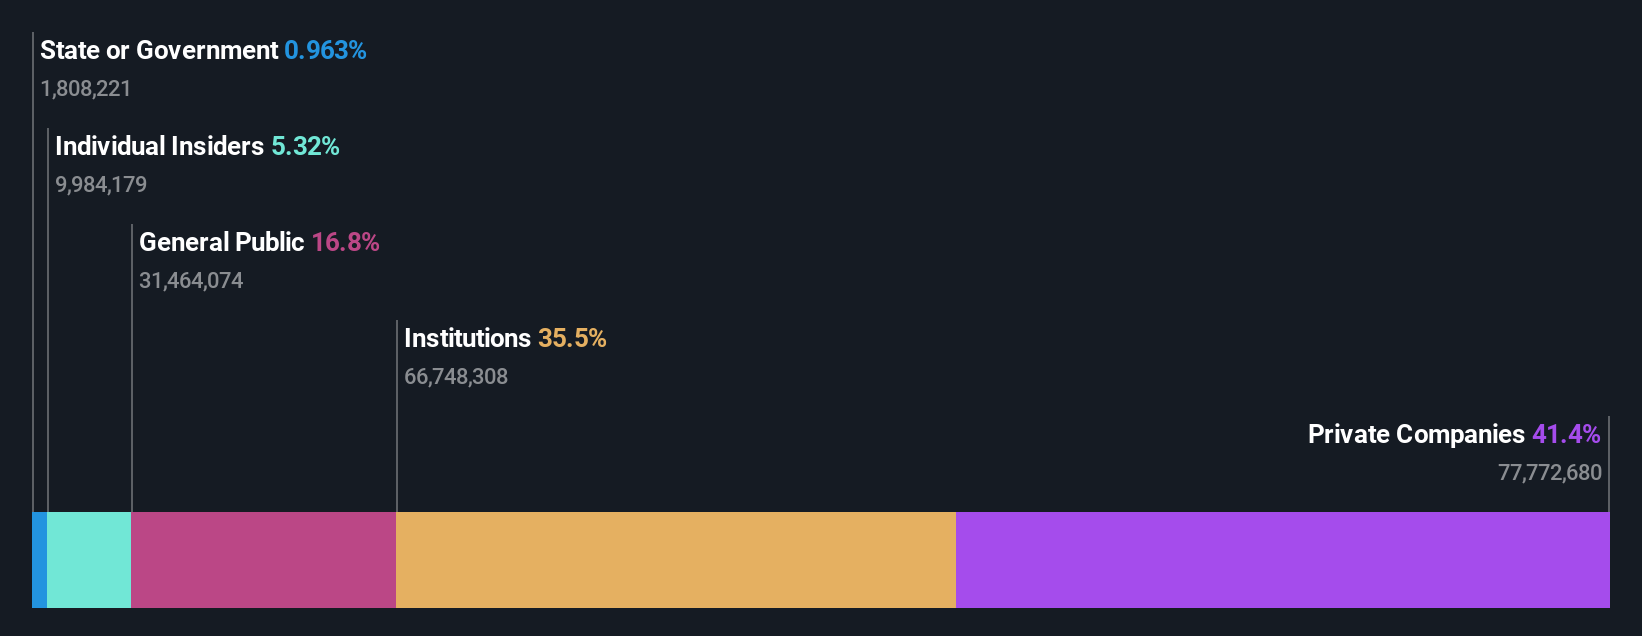
private companies who own 41% along with institutions invested in Cholamandalam Financial Holdings Limited (NSE:CHOLAHLDNG) saw increase in their holdings value last week
Key Insights
- Cholamandalam Financial Holdings' significant private companies ownership suggests that the key decisions are influenced by shareholders from the larger public
- A total of 5 investors have a majority stake in the company with 51% ownership
- Institutions own 36% of Cholamandalam Financial Holdings
Every investor in Cholamandalam Financial Holdings Limited (NSE:CHOLAHLDNG) should be aware of the most powerful shareholder groups. And the group that holds the biggest piece of the pie are private companies with 41% ownership. That is, the group stands to benefit the most if the stock rises (or lose the most if there is a downturn).
Following a 4.0% increase in the stock price last week, private companies profited the most, but institutions who own 36% stock also stood to gain from the increase.
Let's take a closer look to see what the different types of shareholders can tell us about Cholamandalam Financial Holdings.
See our latest analysis for Cholamandalam Financial Holdings
What Does The Institutional Ownership Tell Us About Cholamandalam Financial Holdings?
Institutions typically measure themselves against a benchmark when reporting to their own investors, so they often become more enthusiastic about a stock once it's included in a major index. We would expect most companies to have some institutions on the register, especially if they are growing.
As you can see, institutional investors have a fair amount of stake in Cholamandalam Financial Holdings. This implies the analysts working for those institutions have looked at the stock and they like it. But just like anyone else, they could be wrong. When multiple institutions own a stock, there's always a risk that they are in a 'crowded trade'. When such a trade goes wrong, multiple parties may compete to sell stock fast. This risk is higher in a company without a history of growth. You can see Cholamandalam Financial Holdings' historic earnings and revenue below, but keep in mind there's always more to the story.

Hedge funds don't have many shares in Cholamandalam Financial Holdings. Murugappa Group Ltd. is currently the largest shareholder, with 38% of shares outstanding. For context, the second largest shareholder holds about 4.7% of the shares outstanding, followed by an ownership of 3.2% by the third-largest shareholder.
To make our study more interesting, we found that the top 5 shareholders control more than half of the company which implies that this group has considerable sway over the company's decision-making.
Researching institutional ownership is a good way to gauge and filter a stock's expected performance. The same can be achieved by studying analyst sentiments. There are plenty of analysts covering the stock, so it might be worth seeing what they are forecasting, too.
Insider Ownership Of Cholamandalam Financial Holdings
The definition of an insider can differ slightly between different countries, but members of the board of directors always count. The company management answer to the board and the latter should represent the interests of shareholders. Notably, sometimes top-level managers are on the board themselves.
I generally consider insider ownership to be a good thing. However, on some occasions it makes it more difficult for other shareholders to hold the board accountable for decisions.
We can see that insiders own shares in Cholamandalam Financial Holdings Limited. The insiders have a meaningful stake worth ₹19b. Most would see this as a real positive. If you would like to explore the question of insider alignment, you can click here to see if insiders have been buying or selling.
General Public Ownership
The general public-- including retail investors -- own 17% stake in the company, and hence can't easily be ignored. While this size of ownership may not be enough to sway a policy decision in their favour, they can still make a collective impact on company policies.
Private Company Ownership
It seems that Private Companies own 41%, of the Cholamandalam Financial Holdings stock. It's hard to draw any conclusions from this fact alone, so its worth looking into who owns those private companies. Sometimes insiders or other related parties have an interest in shares in a public company through a separate private company.
Next Steps:
While it is well worth considering the different groups that own a company, there are other factors that are even more important. For example, we've discovered 1 warning sign for Cholamandalam Financial Holdings that you should be aware of before investing here.
If you are like me, you may want to think about whether this company will grow or shrink. Luckily, you can check this free report showing analyst forecasts for its future.
NB: Figures in this article are calculated using data from the last twelve months, which refer to the 12-month period ending on the last date of the month the financial statement is dated. This may not be consistent with full year annual report figures.
Have feedback on this article? Concerned about the content? Get in touch with us directly. Alternatively, email editorial-team (at) simplywallst.com.
This article by Simply Wall St is general in nature. We provide commentary based on historical data and analyst forecasts only using an unbiased methodology and our articles are not intended to be financial advice. It does not constitute a recommendation to buy or sell any stock, and does not take account of your objectives, or your financial situation. We aim to bring you long-term focused analysis driven by fundamental data. Note that our analysis may not factor in the latest price-sensitive company announcements or qualitative material. Simply Wall St has no position in any stocks mentioned.