
- PREMIUM
- LIVE QUOTES
- INSTITUTIONS
 Index Options
 State Street
 CME Group
 Nasdaq
 Cboe
Cboe TradingView
 Wall Street Journal
Reassessing S&P Global (SPGI) Valuation After Strong Multi‑Year Shareholder Returns
S&P Global (SPGI) is back in focus after recent trading left the stock around $512.66, prompting investors to reassess how its credit ratings, data, and index businesses align with current market conditions.
See our latest analysis for S&P Global.
That recent 1 day share price return of 1.9% and 7 day return of 3.29% come after a steadier patch, with a 90 day share price return of 6.53% alongside a 1 year total shareholder return of 4.5% and 3 year total shareholder return of about 50%, suggesting momentum has been building over the medium term.
If you are comparing S&P Global with other data heavy financial names, it can help to widen the lens and look at fast growing stocks with high insider ownership as a source of fresh ideas.
With S&P Global generating US$15.0b in revenue and US$4.2b in net income, and the share price sitting near US$512.66, the key question is whether the current valuation leaves any mispricing or if the market is already fully charging for future growth.
Price-to-Earnings of 36.8x: Is it justified?
On a P/E of 36.8x at a last close of US$512.66, S&P Global screens as expensive compared with both its peers and a modelled fair level.
The P/E multiple tells you how much investors are paying today for each dollar of earnings, which is especially watched for profitable, established information and index providers like S&P Global. A higher P/E often signals that the market is willing to pay up for quality, consistency or expected earnings growth, while a lower P/E can point to lower expectations or higher perceived risk.
In this case, the 36.8x P/E stands well above the US Capital Markets industry average of 25.6x and above the peer average of 32.2x. This suggests investors are paying a clear premium for S&P Global’s earnings. It is also roughly double the estimated fair P/E of 18.4x that our regression based fair ratio identifies as a level the market could move toward if sentiment or expectations ease.
Explore the SWS fair ratio for S&P Global
Result: Price-to-Earnings of 36.8x (OVERVALUED)
However, a rich 36.8x P/E and a regression based fair P/E closer to 18.4x leave little room if earnings growth, regulatory pressure, or sentiment soften.
Find out about the key risks to this S&P Global narrative.
Another View: What Our DCF Model Says
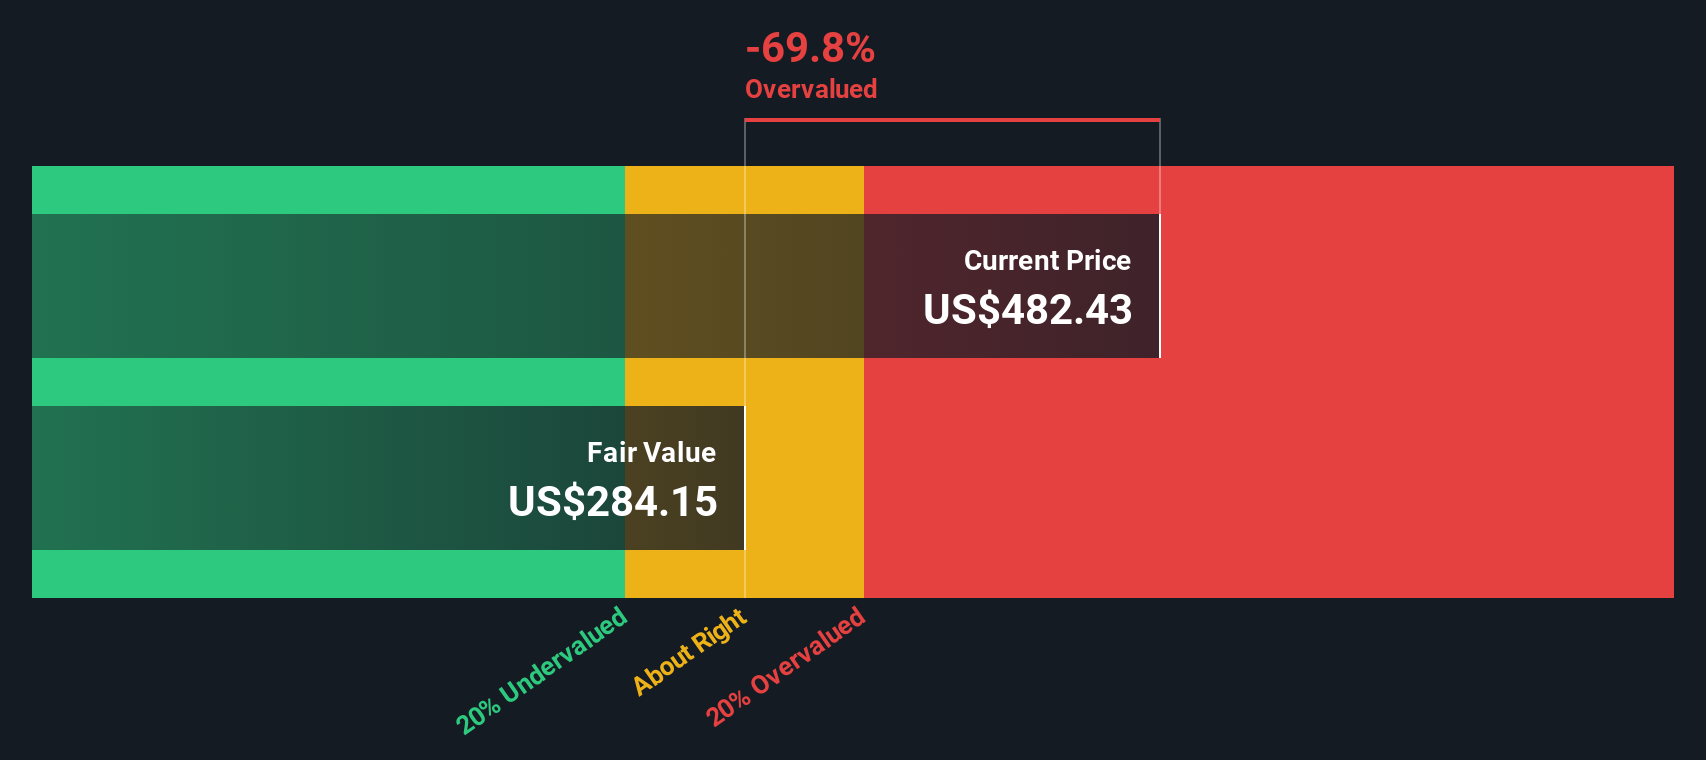
While the 36.8x P/E suggests a rich price tag, the SWS DCF model points in the same direction. On this view, S&P Global at US$512.66 sits above an estimated fair value of US$337.99, which implies less margin for error if expectations cool.
Look into how the SWS DCF model arrives at its fair value.
Simply Wall St performs a discounted cash flow (DCF) on every stock in the world every day (check out S&P Global for example). We show the entire calculation in full. You can track the result in your watchlist or portfolio and be alerted when this changes, or use our stock screener to discover 875 undervalued stocks based on their cash flows. If you save a screener we even alert you when new companies match - so you never miss a potential opportunity.
Build Your Own S&P Global Narrative
If you look at these numbers and reach a different conclusion, or simply want to stress test your own view, you can build a personalised S&P Global story in a few minutes, starting with Do it your way.
A good starting point is our analysis highlighting 2 key rewards investors are optimistic about regarding S&P Global.
Looking for more investment ideas?
Once you have formed a view on S&P Global, do not stop there. Broaden your watchlist with focused stock ideas built from clear, transparent criteria.
- Spot potential mispricings early by checking out these 875 undervalued stocks based on cash flows that line up with your expectations on cash flows and business quality.
- Tap into growth themes by scanning these 25 AI penny stocks that sit at the intersection of technology, automation, and real world applications.
- Strengthen your income focus by reviewing these 14 dividend stocks with yields > 3% that may suit a portfolio built around regular cash returns.
This article by Simply Wall St is general in nature. We provide commentary based on historical data and analyst forecasts only using an unbiased methodology and our articles are not intended to be financial advice. It does not constitute a recommendation to buy or sell any stock, and does not take account of your objectives, or your financial situation. We aim to bring you long-term focused analysis driven by fundamental data. Note that our analysis may not factor in the latest price-sensitive company announcements or qualitative material. Simply Wall St has no position in any stocks mentioned.
Have feedback on this article? Concerned about the content? Get in touch with us directly. Alternatively, email editorial-team@simplywallst.com