
- PREMIUM
- LIVE QUOTES
- INSTITUTIONS
 Index Options
 State Street
 CME Group
 Nasdaq
 Cboe
Cboe TradingView
 Wall Street Journal
XRP Rallies 8% In 24 Hours — ADA, SOL Are Next If These Levels Hold
XRP (CRYPTO: XRP) is up over 8% in 24 hours after breaking out from a downtrend that dominated price action since August’s $3.4 peak, with Cardano (CRYPTO: ADA) and Solana (CRYPTO: SOL) setting up similar breakout patterns.
XRP Reclaims All Short-Term Moving Averages
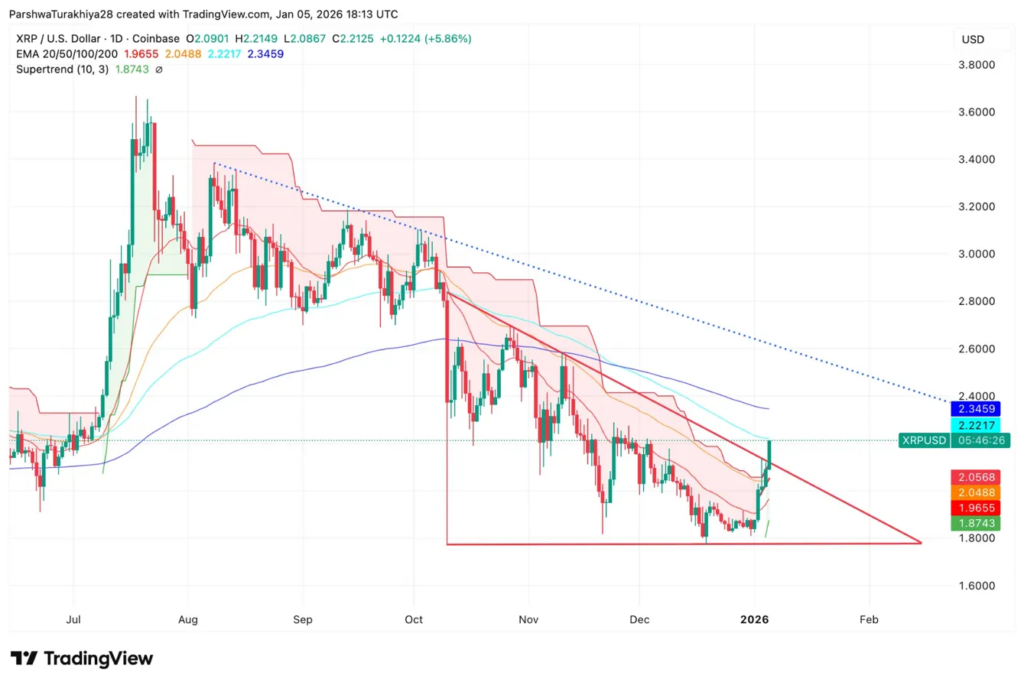
Price Prediction of XRP By TradingView
XRP successfully reclaimed critical support at $1.8 and broke above the 20 EMA at $1.97, 50 EMA at $2.05, and is now testing the 100 EMA at $2.22.
The breakout comes after a successful retest of multi-month lows around $1.80, forming a potential double-bottom pattern that typically signals trend reversal.
The Supertrend indicator flipped to $1.87, now acting as dynamic support rather than resistance—a significant momentum shift.
The sharp vertical move and increasing volume suggest strong buyer conviction after months of consolidation.
The 200 EMA sits at $2.35, representing the next major psychological and technical hurdle.
Upside targets: Immediate resistance at $2.22 (100 EMA), followed by $2.35 (200 EMA). Breaking above $2.40 opens path toward $2.60-$2.70, then $3.00 and descending trendline resistance around $3.20-$3.40.
Downside risks: Support at $2.05 (50 EMA), secondary support at $1.96 (20 EMA), critical floor at $1.87 (Supertrend). Failure below $1.80 invalidates bullish structure, targeting $1.60-$1.70.
ADA Breaks Out From Falling Wedge
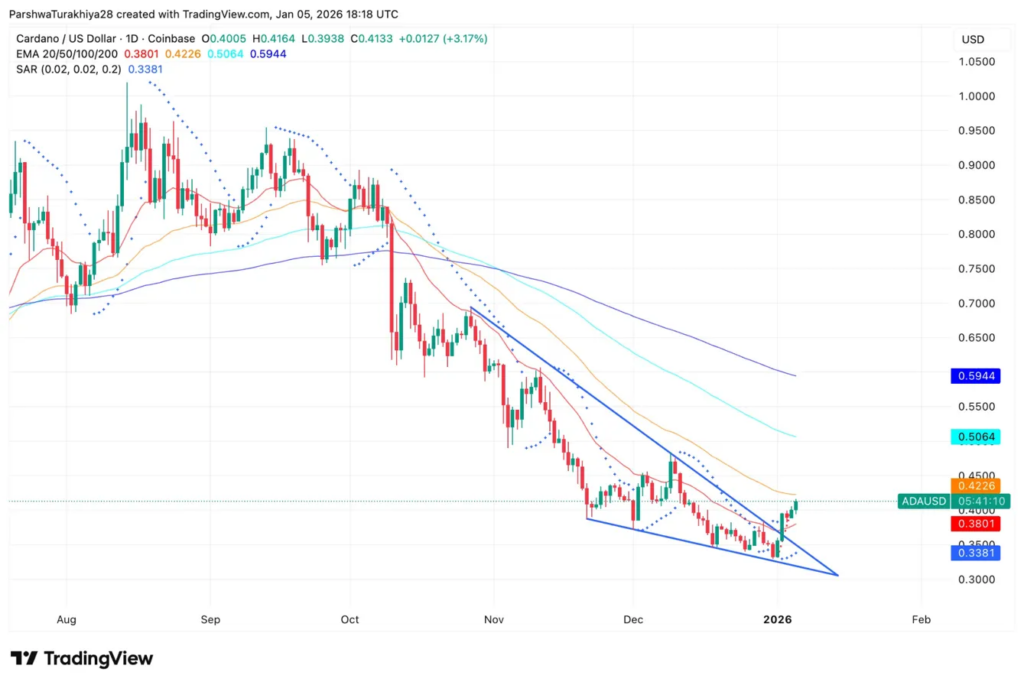
Cardano Price Action By TradingView
ADA also rallied over 4%, executing a dramatic breakout from a falling wedge pattern that compressed price action since October.
After bottoming near $0.35 in late December, ADA pierced through the wedge’s upper boundary and is now testing the 20 EMA at $0.38.
Falling wedges typically resolve to the upside, and this breakout is accompanied by strong volume, suggesting genuine buying interest rather than a false move.
The SAR indicator flipped to $0.34, providing dynamic support below current price.
The wedge breakout projects a measured move target around $0.50-$0.52, aligning with the 100 EMA.
Upside targets: First resistance at $0.42 (50 EMA), then $0.45-$0.47. Breaking $0.50 targets the 100 EMA at $0.51, with ultimate resistance at $0.59 (200 EMA). Clearing $0.60 opens path toward $0.70-$0.75.
Downside risks: Support at $0.38 (20 EMA), critical support at $0.35 wedge base. Loss of $0.34 (SAR) invalidates the breakout, targeting $0.30-$0.32.
SOL Breaks Above 20 EMA After Double Bottom
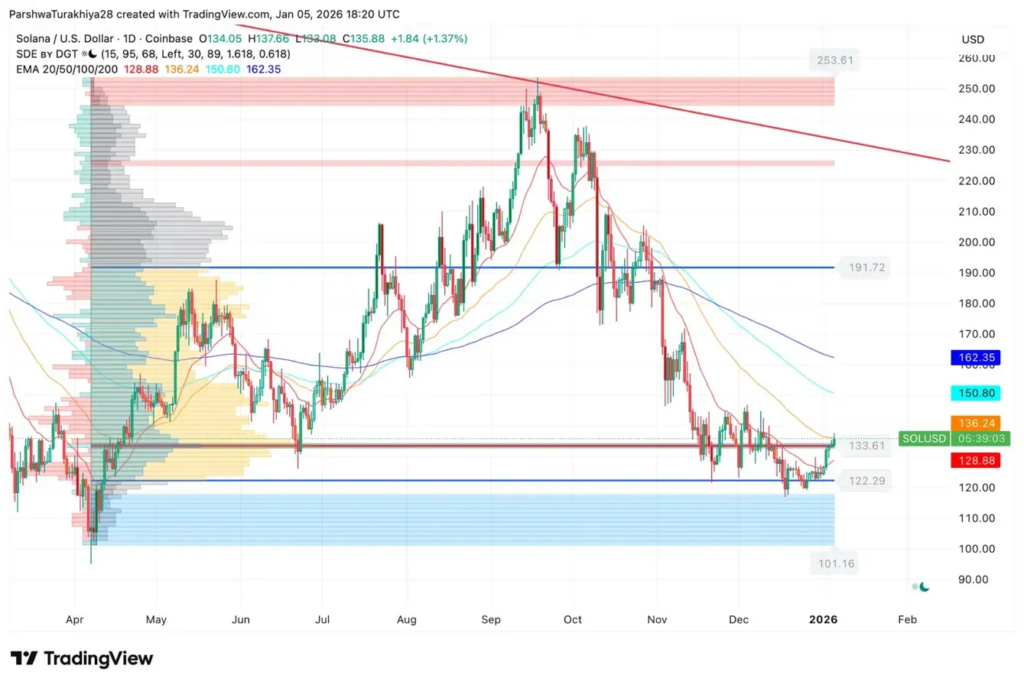
Solana Price Dynamics By TradingView
SOL is up over 2%, breaking above the 20 EMA at $128.88 after defending the critical $120-$122 support zone through multiple December tests.
Massive trading activity clusters between $120-$140, establishing this as a major accumulation zone where institutional players stepped in.
Price formed a clear double-bottom pattern at $122, gaining credibility when combined with high-volume support.
The real test lies at the $133-$140 resistance band before the heavy supply zone at $191.
The descending trendline from November’s $240 peak continues to pressure price, currently intersecting around $145.
Upside targets: $140 breaks the 50 EMA and descending trendline convergence. Beyond this, $150 (100 EMA), then $162 (200 EMA). The critical battleground sits at $191. Clearing $191 opens $220-$240.
Downside risks: $128 (20 EMA) must hold as support. Breaking $122 collapses the double-bottom structure, targeting $110-$115. Ultimate support at $101.
Read Next:
Image: Shutterstock