
- PREMIUM
- LIVE QUOTES
- INSTITUTIONS
 Index Options
 State Street
 CME Group
 Nasdaq
 Cboe
Cboe TradingView
 Wall Street Journal
Hidden Opportunities in Australian Stocks for January 2026
As we usher in 2026, the Australian market has been marked by a flat trading session with materials leading gains, while IT sectors lagged behind. In this landscape of cautious optimism and sector-specific movements, identifying hidden opportunities requires a keen eye for stocks that can thrive despite broader market uncertainties.
Top 10 Undiscovered Gems With Strong Fundamentals In Australia
| Name | Debt To Equity | Revenue Growth | Earnings Growth | Health Rating |
|---|---|---|---|---|
| Fiducian Group | NA | 10.00% | 9.57% | ★★★★★★ |
| Joyce | NA | 9.93% | 17.54% | ★★★★★★ |
| Hearts and Minds Investments | NA | 56.27% | 59.19% | ★★★★★★ |
| Euroz Hartleys Group | NA | 1.82% | -25.32% | ★★★★★★ |
| Argosy Minerals | NA | -12.81% | -19.89% | ★★★★★★ |
| Focus Minerals | NA | 75.35% | 51.34% | ★★★★★★ |
| Energy World | NA | -47.50% | -44.86% | ★★★★★☆ |
| Zimplats Holdings | 5.44% | -9.79% | -42.03% | ★★★★★☆ |
| Peet | 53.46% | 12.70% | 31.21% | ★★★★☆☆ |
| Australian United Investment | 1.90% | 5.23% | 4.56% | ★★★★☆☆ |
Here we highlight a subset of our preferred stocks from the screener.
Cedar Woods Properties (ASX:CWP)
Simply Wall St Value Rating: ★★★★★★
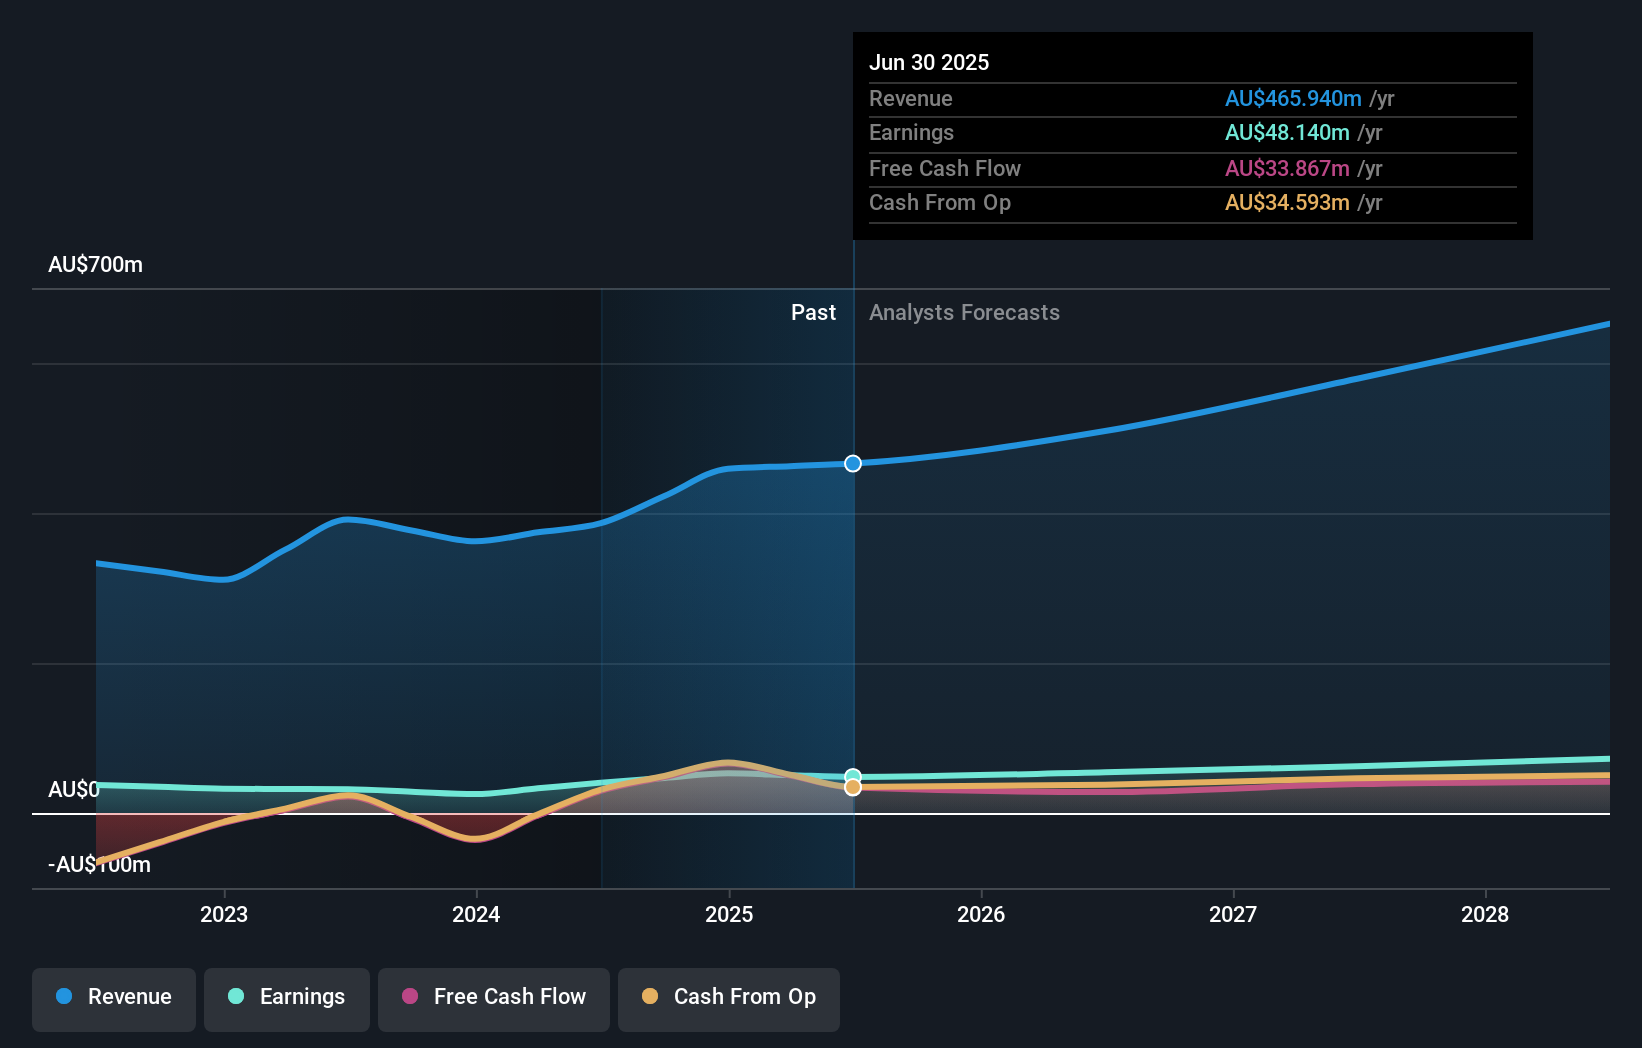
Overview: Cedar Woods Properties Limited is an Australian company that focuses on property development and investment, with a market cap of A$727.40 million.
Operations: Cedar Woods Properties generates revenue primarily from its property development and investment activities, totaling A$465.94 million. The company's financial performance is influenced by its cost structure, which impacts the net profit margin.
Cedar Woods Properties, a notable player in the Australian property market, has shown consistent earnings growth of 12.1% annually over the past five years. The company's net debt to equity ratio stands at a satisfactory 25.8%, with interest payments well-covered by EBIT at 7.2 times. Trading at 43.8% below its estimated fair value, Cedar Woods is poised for further growth with an expected earnings increase of 19.8% per year and a robust presales pipeline valued at A$660 million providing revenue stability. Despite challenges like potential interest rate hikes and rising construction costs, recent guidance indicates record profits for financial year 2026, supporting increased dividends and reflecting strong sales volumes.
IVE Group (ASX:IGL)
Simply Wall St Value Rating: ★★★★★☆
Overview: IVE Group Limited, along with its subsidiaries, operates in the marketing sector in Australia and has a market capitalization of A$465.68 million.
Operations: IVE Group generates revenue primarily from its advertising segment, amounting to A$959.25 million.
IVE Group, a small player in Australia's media and communications sector, has shown impressive financial performance with earnings growth of 69.2% over the past year. This growth outpaced the broader media industry, which saw a contraction of 42.8%. Despite its high net debt to equity ratio at 51.7%, IVE's interest payments are well covered by EBIT at 5.1 times coverage, indicating solid operational efficiency. The company's debt to equity ratio has improved from 105.1% to 75.2% over five years, suggesting prudent financial management while trading at a significant discount of 72.8% below estimated fair value offers potential upside for investors.
- Take a closer look at IVE Group's potential here in our health report.
Gain insights into IVE Group's historical performance by reviewing our past performance report.

Mayfield Group Holdings (ASX:MYG)
Simply Wall St Value Rating: ★★★★★★
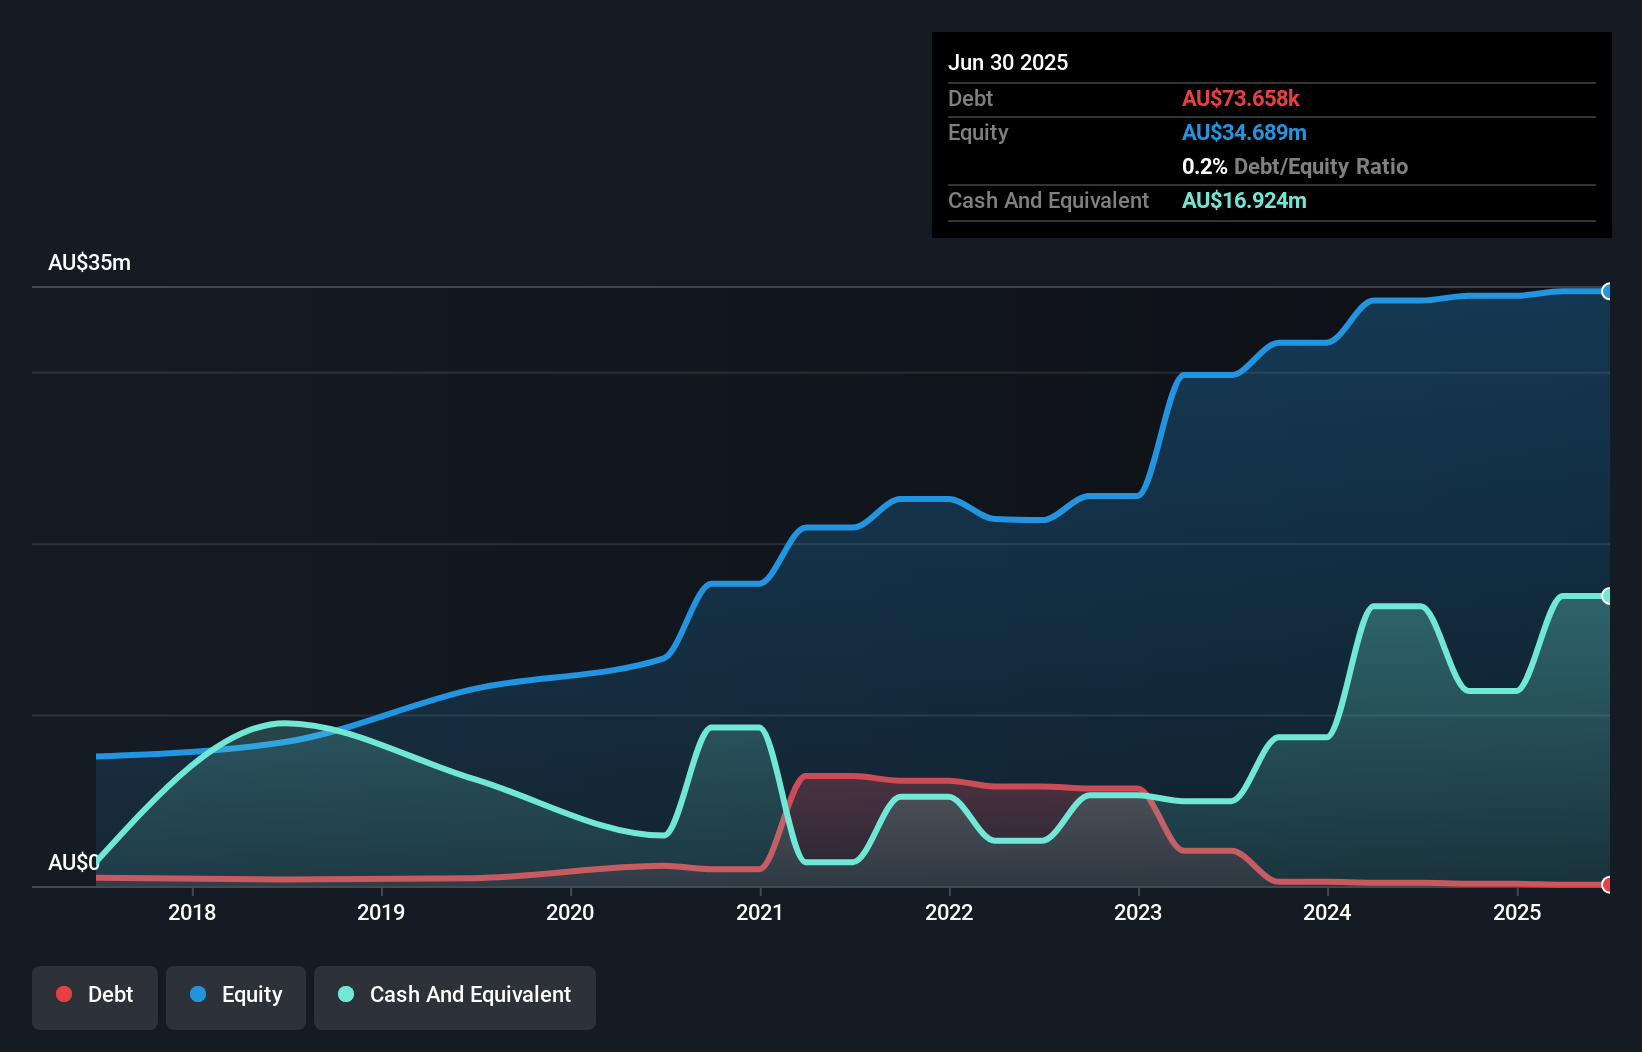
Overview: Mayfield Group Holdings Limited, along with its subsidiaries, offers electrical and telecommunications infrastructure products and services in Australia, with a market capitalization of A$376 million.
Operations: Mayfield Group Holdings generates revenue primarily from its electrical and telecommunications infrastructure segment, amounting to A$118.14 million. The company's financial performance can be analyzed through its net profit margin trends over recent periods.
Mayfield Group Holdings, a notable player in the electrical industry, has seen its earnings grow by 32.5% over the past year, outpacing the industry's 9.9% growth rate. With a debt to equity ratio that has improved from 8.9% to just 0.2% in five years, it appears financially stable and holds more cash than total debt, easing concerns about interest payments. Despite recent significant insider selling and shareholder dilution due to follow-on equity offerings totaling A$33 million at A$1.90 per share, the company remains profitable with high-quality earnings and positive free cash flow of A$15 million as of June 2024.
- Click to explore a detailed breakdown of our findings in Mayfield Group Holdings' health report.
Explore historical data to track Mayfield Group Holdings' performance over time in our Past section.
Where To Now?
- Get an in-depth perspective on all 59 ASX Undiscovered Gems With Strong Fundamentals by using our screener here.
- Have you diversified into these companies? Leverage the power of Simply Wall St's portfolio to keep a close eye on market movements affecting your investments.
- Simply Wall St is a revolutionary app designed for long-term stock investors, it's free and covers every market in the world.
Contemplating Other Strategies?
- Explore high-performing small cap companies that haven't yet garnered significant analyst attention.
- Fuel your portfolio with companies showing strong growth potential, backed by optimistic outlooks both from analysts and management.
- Find companies with promising cash flow potential yet trading below their fair value.
This article by Simply Wall St is general in nature. We provide commentary based on historical data and analyst forecasts only using an unbiased methodology and our articles are not intended to be financial advice. It does not constitute a recommendation to buy or sell any stock, and does not take account of your objectives, or your financial situation. We aim to bring you long-term focused analysis driven by fundamental data. Note that our analysis may not factor in the latest price-sensitive company announcements or qualitative material. Simply Wall St has no position in any stocks mentioned.
Have feedback on this article? Concerned about the content? Get in touch with us directly. Alternatively, email editorial-team@simplywallst.com