
- PREMIUM
- LIVE QUOTES
- INSTITUTIONS
 Index Options
 State Street
 CME Group
 Nasdaq
 Cboe
Cboe TradingView
 Wall Street Journal
A Look At Chubb (CB) Valuation As Shares Trade Near Narrative Fair Value
Chubb stock reaction and recent performance
Chubb (CB) shares recently traded around $310.06, and the stock has been relatively steady over the past week after a small 1 day decline, keeping recent gains in focus for investors.
See our latest analysis for Chubb.
That recent 5.11% 1 month share price return builds on a 7.20% 3 month gain, while the 1 year total shareholder return of 17.53% points to momentum that has been gradually building rather than fading.
If Chubb has you thinking about insurance exposure, it can help to see how the rest of the sector stacks up, including other healthcare stocks that may balance your portfolio.
With Chubb trading close to its analyst price target and showing a value score of 4, the key question is whether that 53% intrinsic discount hints at mispricing or whether the market already reflects its future growth.
Most Popular Narrative: 30% Undervalued
With Chubb last closing at US$310.06 against a narrative fair value of about US$311.09, the valuation case rests more on expectations than a large price gap.
Capital deployment through ongoing share repurchases (new $5B authorization), growing dividends, and selective M&A is creating upward pressure on earnings per share (EPS). Robust cash flow and the capital position provide flexibility for further shareholder returns.
Want to see what really sits behind that earnings and margin story, and the lower future P/E multiple? The full narrative sets out the revenue drag, profit lift and discount rate assumptions in detail so you can judge how demanding they are for yourself.
Result: Fair Value of $311.09 (UNDERVALUED)
Have a read of the narrative in full and understand what's behind the forecasts.
However, those assumptions can be tested quickly if catastrophe losses stay elevated, or if pricing pressure and rising litigation costs squeeze margins more than expected.
Find out about the key risks to this Chubb narrative.
Another View: What The P/E Is Telling You
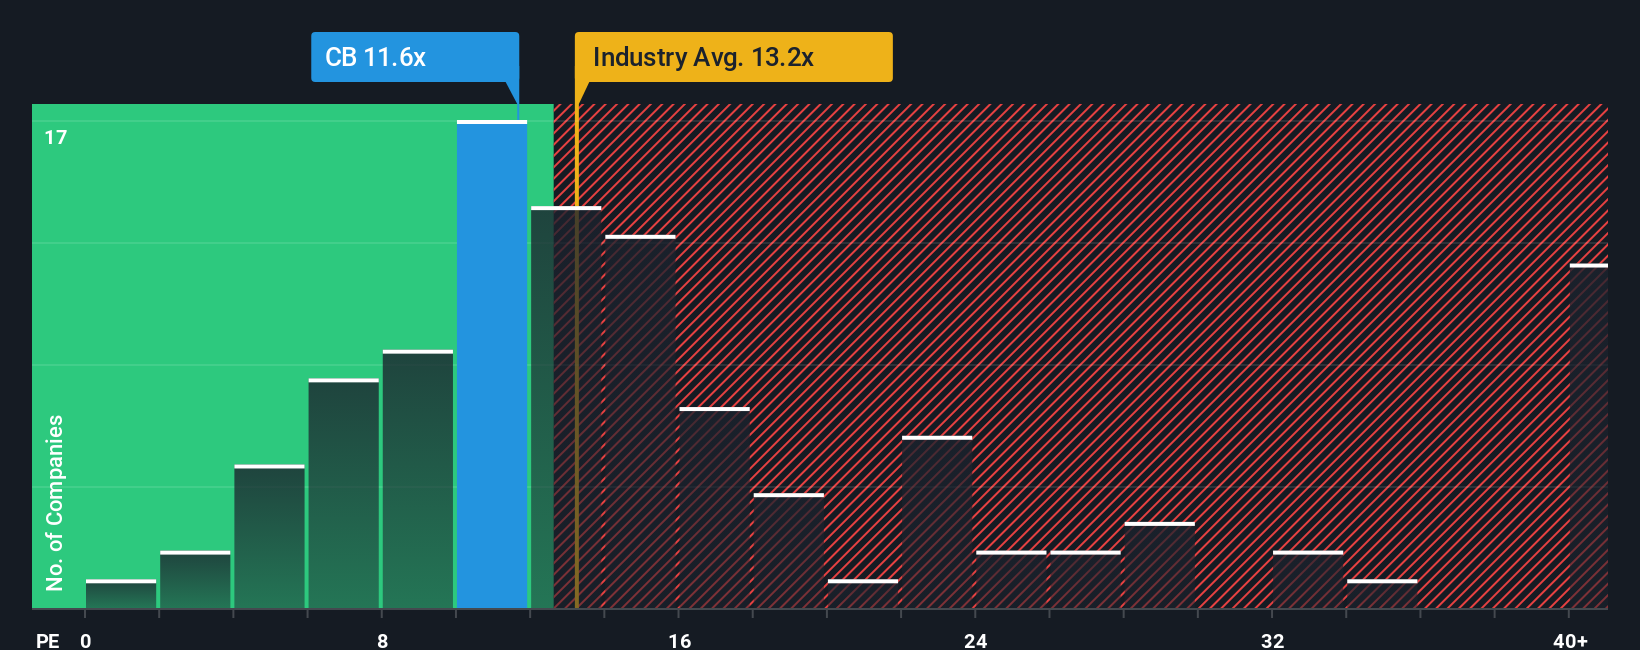
While our fair value work suggests Chubb is trading below intrinsic value, the P/E picture is more cautious. At 12.6x earnings, Chubb sits just under the US Insurance industry at 12.9x, and below its own fair ratio of 14.4x, indicating a milder valuation gap. This may reflect either a patient opportunity for investors or a sign that the market is pricing in certain risks.
See what the numbers say about this price — find out in our valuation breakdown.
Build Your Own Chubb Narrative
If you look at the numbers and come to a different conclusion, or simply want to test your own thesis, you can build a complete Chubb view in just a few minutes and shape it exactly how you like it, Do it your way.
A great starting point for your Chubb research is our analysis highlighting 2 key rewards and 1 important warning sign that could impact your investment decision.
Looking for more investment ideas?
If Chubb is on your radar, do not stop there. A few minutes with targeted stock lists can quickly surface ideas that fit your style and risk tolerance.
- Spot potential bargains early by scanning these 870 undervalued stocks based on cash flows that align with your expectations on cash flows and price.
- Capture growth themes at the source by checking out these 25 AI penny stocks that sit at the heart of the AI trend.
- Boost your income focus by reviewing these 14 dividend stocks with yields > 3% that already offer higher yields, before they move out of reach.
This article by Simply Wall St is general in nature. We provide commentary based on historical data and analyst forecasts only using an unbiased methodology and our articles are not intended to be financial advice. It does not constitute a recommendation to buy or sell any stock, and does not take account of your objectives, or your financial situation. We aim to bring you long-term focused analysis driven by fundamental data. Note that our analysis may not factor in the latest price-sensitive company announcements or qualitative material. Simply Wall St has no position in any stocks mentioned.
Have feedback on this article? Concerned about the content? Get in touch with us directly. Alternatively, email editorial-team@simplywallst.com