
- PREMIUM
- LIVE QUOTES
- INSTITUTIONS
 Index Options
 State Street
 CME Group
 Nasdaq
 Cboe
Cboe TradingView
 Wall Street Journal
A Look At J. M. Smucker’s Valuation As Recent Weakness Draws Investor Attention
Why J. M. Smucker Is On Investors’ Radar Today
J. M. Smucker (SJM) is drawing attention as investors reassess its recent share performance, with the stock closing at $96.63 and showing negative returns over the past week, month, and past 3 months.
See our latest analysis for J. M. Smucker.
The recent weakness in SJM’s 7 day and 3 month share price returns, alongside a 1 year total shareholder return decline of 7.88% and a 3 year total shareholder return decline of 32.93%, points to fading momentum despite a relatively flat year to date share price return.
If this kind of move has you rethinking where you look for opportunities, it could be a good moment to broaden your watchlist with fast growing stocks with high insider ownership.
With SJM trading at $96.63 and flagged as trading at a discount to some estimated value, the key question now is simple: is this weakness a potential entry point, or is the market already pricing in future growth?
Most Popular Narrative: 16.8% Undervalued
At a last close of $96.63 against a narrative fair value of $116.19, J. M. Smucker is framed as attractively priced with a long term focus on earnings quality.
Increased free cash flow generation (with a raised outlook for FY26 and ongoing annual benefits) provides resources to de-leverage, reinvest, or support strategic brand-building and automation initiatives, strengthening earnings quality and balance sheet flexibility over the long term.
Curious what kind of revenue path, margin rebuild, and earnings level need to line up to support that fair value? The full narrative spells out those targets, the assumed profitability shift, and the valuation multiple that has to hold for this price to make sense.
Result: Fair Value of $116.19 (UNDERVALUED)
Have a read of the narrative in full and understand what's behind the forecasts.
However, there are still real pressure points to watch, including tariff costs hitting coffee margins and the risk that further price hikes push volumes and legacy brands under more strain.
Find out about the key risks to this J. M. Smucker narrative.
Another View: Multiples Paint A Different Picture
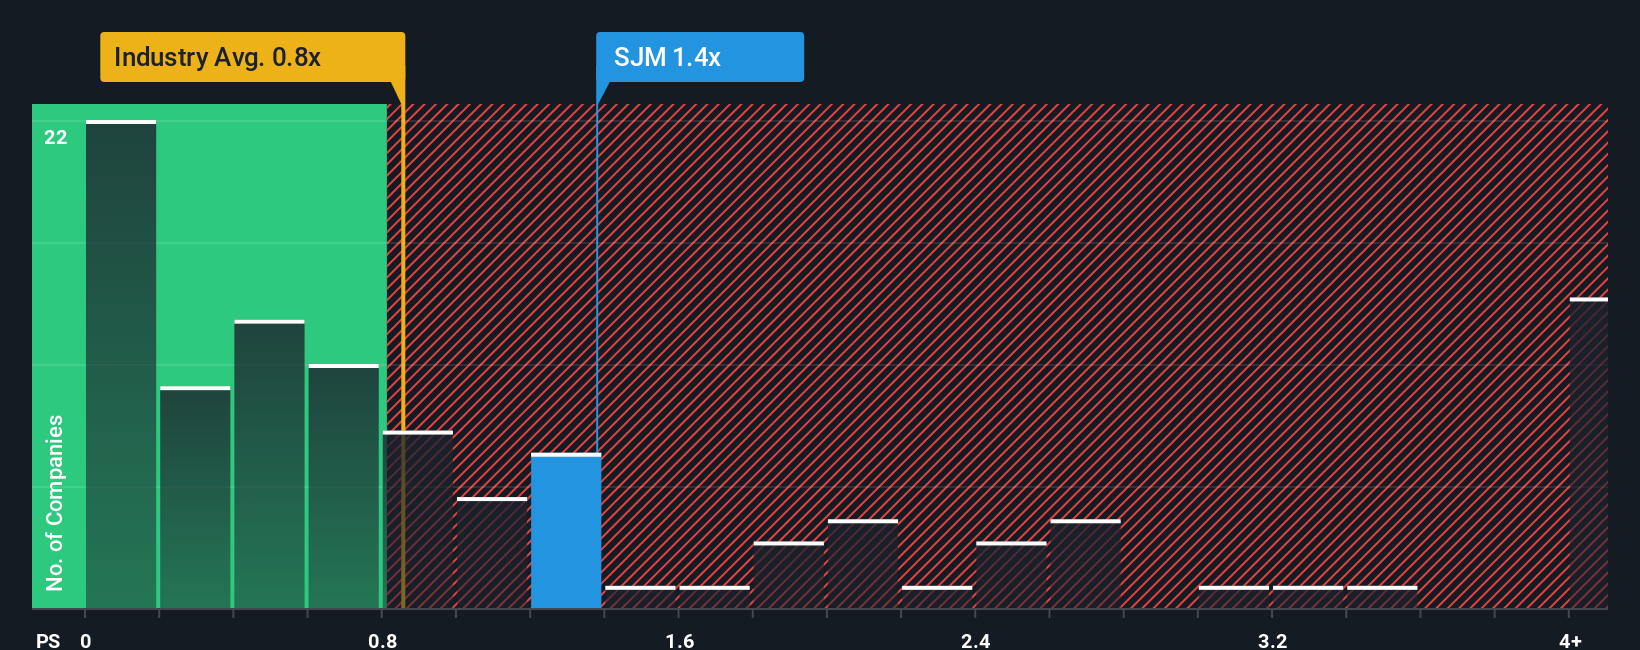
Here is the twist. While one narrative points to J. M. Smucker trading at a steep discount to an estimated fair value, its current P/S ratio of 1.2x sits well above both the US Food industry average of 0.6x and a 0.7x peer average, even though it aligns with the 1.2x fair ratio. That mix of apparent discount and richer sales multiple raises a simple question for you: is the market mispricing the future, or is the cash flow model too optimistic?
See what the numbers say about this price — find out in our valuation breakdown.
Build Your Own J. M. Smucker Narrative
If you look at the numbers and reach a different conclusion, or just prefer your own work, you can build a complete view in minutes with Do it your way.
A great starting point for your J. M. Smucker research is our analysis highlighting 3 key rewards and 2 important warning signs that could impact your investment decision.
Looking for more investment ideas?
If SJM has your attention, do not stop here; broaden your opportunity set and pressure test your thinking against other themes and sectors using focused stock screens.
- Scan for value driven ideas by checking out these 870 undervalued stocks based on cash flows that match your preference for pricing grounded in cash flows.
- Zero in on income potential by reviewing these 14 dividend stocks with yields > 3% that might fit a yield focused watchlist.
- Position yourself early in structural shifts by tracking these 79 cryptocurrency and blockchain stocks tied to blockchain and digital asset trends.
This article by Simply Wall St is general in nature. We provide commentary based on historical data and analyst forecasts only using an unbiased methodology and our articles are not intended to be financial advice. It does not constitute a recommendation to buy or sell any stock, and does not take account of your objectives, or your financial situation. We aim to bring you long-term focused analysis driven by fundamental data. Note that our analysis may not factor in the latest price-sensitive company announcements or qualitative material. Simply Wall St has no position in any stocks mentioned.
Have feedback on this article? Concerned about the content? Get in touch with us directly. Alternatively, email editorial-team@simplywallst.com