
- PREMIUM
- LIVE QUOTES
- INSTITUTIONS
 Index Options
 State Street
 CME Group
 Nasdaq
 Cboe
Cboe TradingView
 Wall Street Journal
Is It Time To Reconsider ServiceNow (NOW) After Recent Software Sector Sentiment Shift
- If you are wondering whether ServiceNow's current share price lines up with its long term potential, this article walks through what the numbers are really saying about value.
- The stock last closed at US$147.45, with returns of a 4.6% decline over 7 days, a 13.7% decline over 30 days, flat performance year to date, a 31.5% decline over 1 year and a 94.8% gain over 3 years alongside a 40.9% gain over 5 years.
- Recent news flow around ServiceNow has focused on its role as a major workflow and digital transformation platform, with investors weighing how this positioning fits into long term IT spending priorities. Headlines have also highlighted broader sentiment toward large software names, which can influence how quickly investors are willing to reprice growth and risk for companies such as ServiceNow.
- Our valuation model currently gives ServiceNow a value score of 3 out of 6. Next we will walk through the key valuation approaches behind that score, then finish with a simpler way to think about what the current price might mean for you.
Find out why ServiceNow's -31.5% return over the last year is lagging behind its peers.
Approach 1: ServiceNow Discounted Cash Flow (DCF) Analysis
A Discounted Cash Flow, or DCF, model takes estimates of the cash a company could generate in the future and discounts those amounts back to today, giving you an estimate of what the business might be worth in $ right now.
For ServiceNow, the model starts with last twelve months Free Cash Flow of about $3.88b. Analysts have supplied detailed forecasts for the next few years. Beyond that, Simply Wall St extends those projections out to 2035 using a 2 Stage Free Cash Flow to Equity approach. By 2030, projected Free Cash Flow is $10.97b, with each of the annual figures between 2026 and 2035 converted into present values using a discount rate to reflect risk and the time value of money.
When you total all those discounted cash flows, the model arrives at an intrinsic value of about $199.18 per share. Versus the recent share price of $147.45, this implies the stock is around 26.0% undervalued according to this DCF framework.
Result: UNDERVALUED
Our Discounted Cash Flow (DCF) analysis suggests ServiceNow is undervalued by 26.0%. Track this in your watchlist or portfolio, or discover 870 more undervalued stocks based on cash flows.
Approach 2: ServiceNow Price vs Earnings
For profitable companies, the P/E ratio is a useful way to connect what you pay for each share with the earnings that business is currently generating. It gives you a simple, comparable yardstick for what the market is willing to pay for each dollar of profit.
What counts as a normal or fair P/E depends on how the market views a company’s growth potential and risk. Higher expected earnings growth and lower perceived risk often support a higher multiple, while slower growth or higher uncertainty usually point to a lower one.
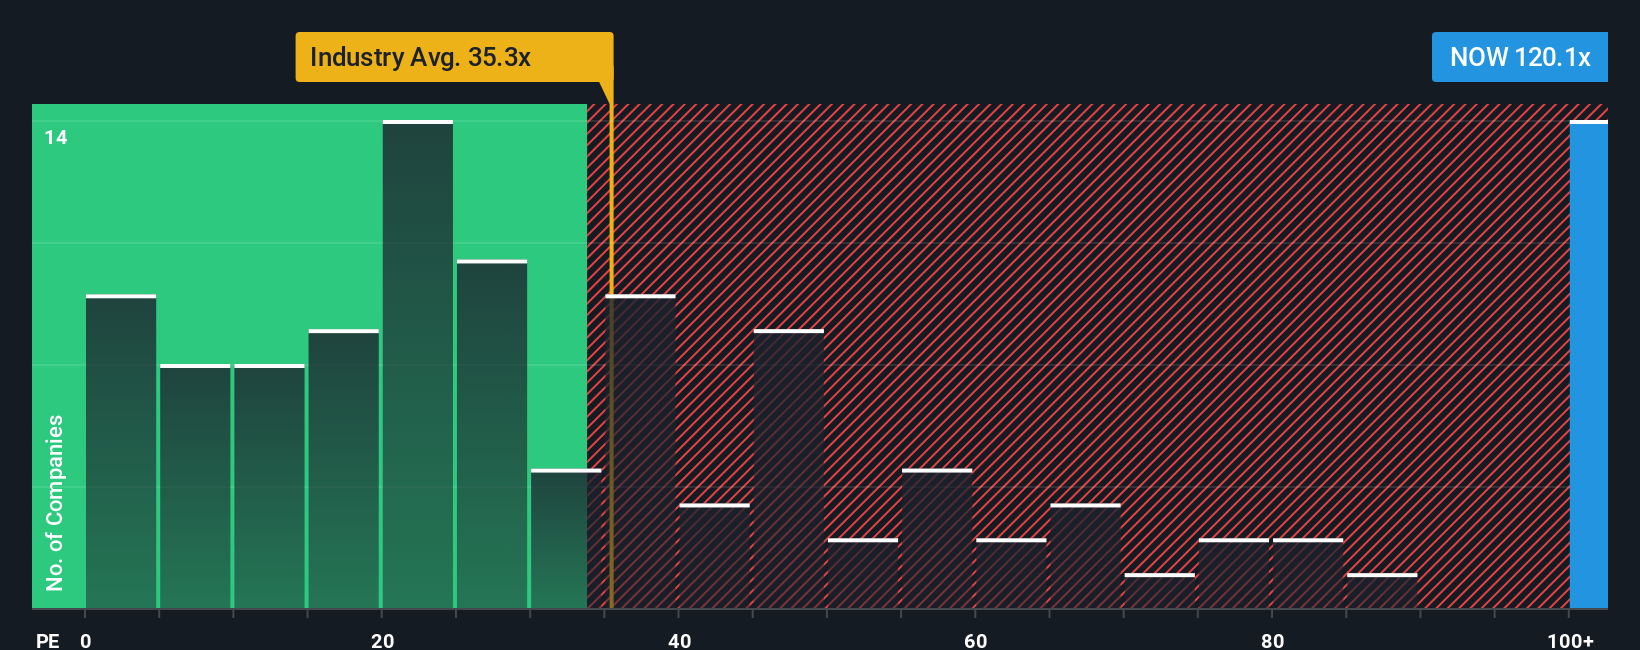
ServiceNow currently trades on a P/E of 88.37x. That sits well above the Software industry average of 31.74x and also above the peer group average of 49.64x. Simply Wall St’s Fair Ratio for ServiceNow is 43.72x, which is a proprietary estimate of what its P/E might be given factors such as earnings growth profile, industry, profit margins, market cap and company specific risks.
This Fair Ratio can be more informative than a simple peer or industry comparison because it adjusts for those business specific drivers rather than assuming all software names deserve the same multiple. Compared with that 43.72x Fair Ratio, the current 88.37x P/E points to ServiceNow trading on a richer multiple than the model suggests.
Result: OVERVALUED
P/E ratios tell one story, but what if the real opportunity lies elsewhere? Discover 1462 companies where insiders are betting big on explosive growth.
Upgrade Your Decision Making: Choose your ServiceNow Narrative
Earlier we mentioned that there is an even better way to understand valuation, so let us introduce you to Narratives, which are simple stories you create about ServiceNow that link your view of its future revenue, earnings and margins to a financial forecast and then to a fair value that you can compare with the current share price to decide if it looks attractive or stretched.
On Simply Wall St, Narratives sit inside the Community page and are built to be easy to use, so you can plug in assumptions, see the fair value that drops out of those numbers, and have that view update automatically when new information such as earnings, product announcements or major partnerships is added to the platform.
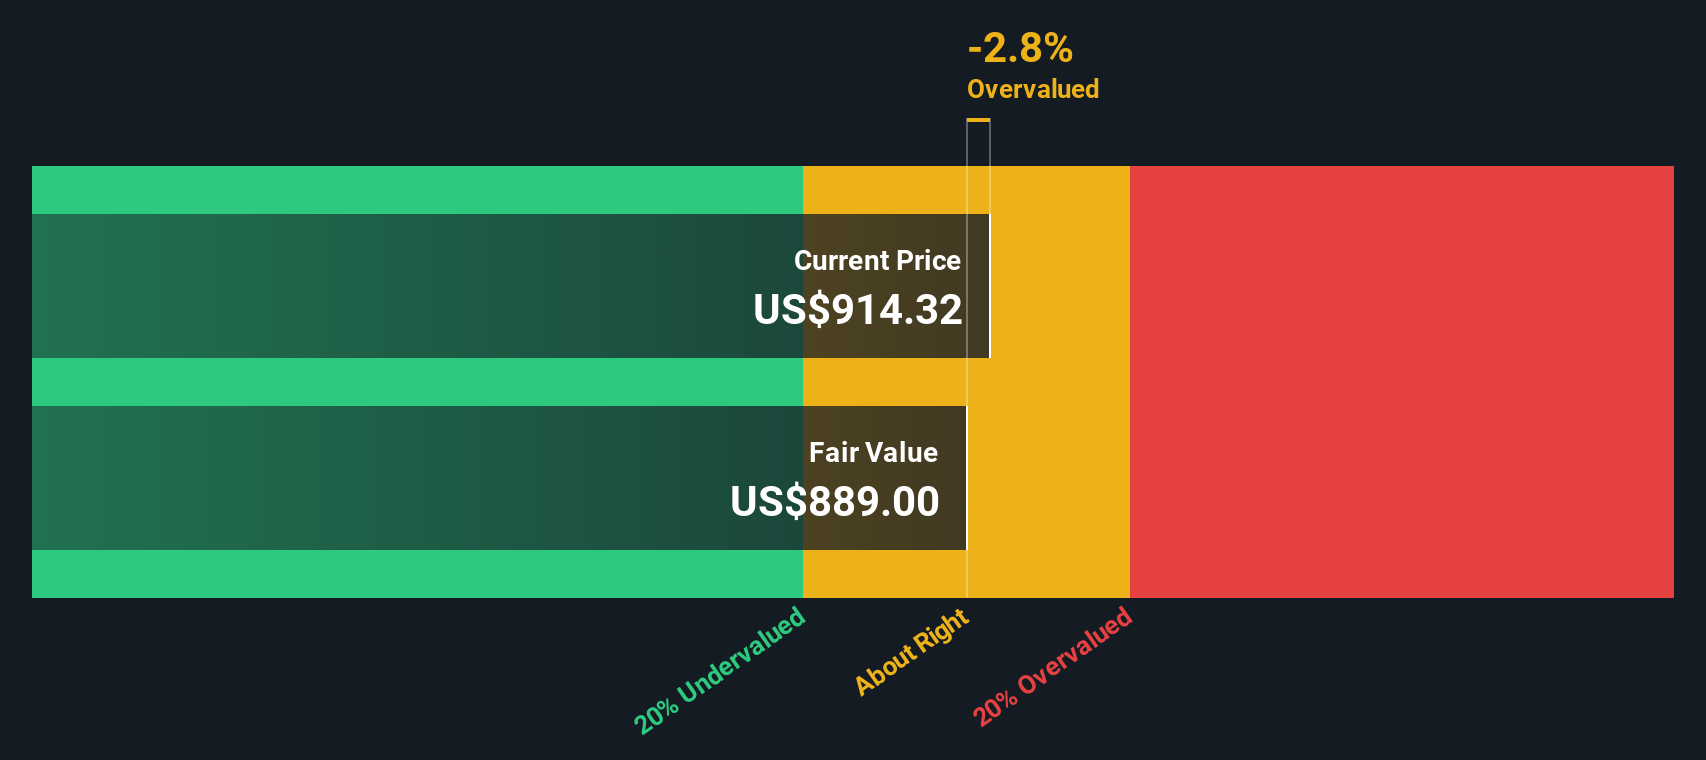
For example, one ServiceNow Narrative on the platform currently points to a fair value of about US$1,332 per share based on higher long term margin expectations. A more cautious Narrative points to a fair value of about US$904 per share. Seeing that spread helps you decide which story feels closer to your own view before you compare any fair value to the latest market price.
Do you think there's more to the story for ServiceNow? Head over to our Community to see what others are saying!

This article by Simply Wall St is general in nature. We provide commentary based on historical data and analyst forecasts only using an unbiased methodology and our articles are not intended to be financial advice. It does not constitute a recommendation to buy or sell any stock, and does not take account of your objectives, or your financial situation. We aim to bring you long-term focused analysis driven by fundamental data. Note that our analysis may not factor in the latest price-sensitive company announcements or qualitative material. Simply Wall St has no position in any stocks mentioned.
Have feedback on this article? Concerned about the content? Get in touch with us directly. Alternatively, email editorial-team@simplywallst.com