
- PREMIUM
- LIVE QUOTES
- INSTITUTIONS
 Index Options
 State Street
 CME Group
 Nasdaq
 Cboe
Cboe TradingView
 Wall Street Journal
Is Honeywell (HON) Offering Value After Recent Mixed Share Price Performance?
- If you are wondering whether Honeywell International at around US$195.88 is offering fair value or a potential bargain, you are in the right place.
- The stock has been fairly mixed recently, with a 0.6% decline over the last 7 days, a 2.4% gain over the last 30 days, flat performance year to date, and a 4.2% decline over the past year, while returns over 3 and 5 years sit at 5.3% and 10.5% respectively.
- Recent attention on Honeywell has largely centered on its position as a diversified industrial and technology company, touching areas such as aerospace, building technologies, and performance materials. This positioning can influence how investors think about its long term prospects. Broader sector sentiment and macro headlines around industrial activity and interest rates have also been part of the backdrop for the recent share price moves.
- Right now, Honeywell scores 5 out of 6 on our valuation checks, giving it a value score of 5. Next, we will walk through what that means using standard valuation approaches, before finishing with a way to assess value that can give you a fuller picture than price ratios alone.
Find out why Honeywell International's -4.2% return over the last year is lagging behind its peers.
Approach 1: Honeywell International Discounted Cash Flow (DCF) Analysis
A Discounted Cash Flow, or DCF, model estimates what a business could be worth today by projecting its future cash flows and then discounting those back to the present using a required rate of return.
For Honeywell International, the model used is a 2 Stage Free Cash Flow to Equity approach. The company’s latest twelve month free cash flow is about $6.29b. Analysts provide free cash flow estimates for several years, and Simply Wall St then extends those projections further. By 2028, annual free cash flow is projected at $7.19b, and the model also carries projections out to 2035, with each future cash flow discounted back to today in dollar terms.
Putting those discounted cash flows together gives an estimated intrinsic value of about $248.08 per share, compared with the current price around $195.88. That implies Honeywell trades at roughly a 21.0% discount to this DCF estimate, which points to the shares being undervalued on this cash flow view.
Result: UNDERVALUED
Our Discounted Cash Flow (DCF) analysis suggests Honeywell International is undervalued by 21.0%. Track this in your watchlist or portfolio, or discover 868 more undervalued stocks based on cash flows.

Approach 2: Honeywell International Price vs Earnings
For a profitable company like Honeywell International, the P/E ratio is a useful shorthand because it links what you pay per share to the earnings the business is already generating. It helps you compare how the market prices those earnings against other companies.
What counts as a “normal” P/E depends on what investors expect for future growth and how much risk they see in those earnings. Higher expected growth or lower perceived risk can justify a higher multiple, while slower growth or higher risk usually lines up with a lower one.
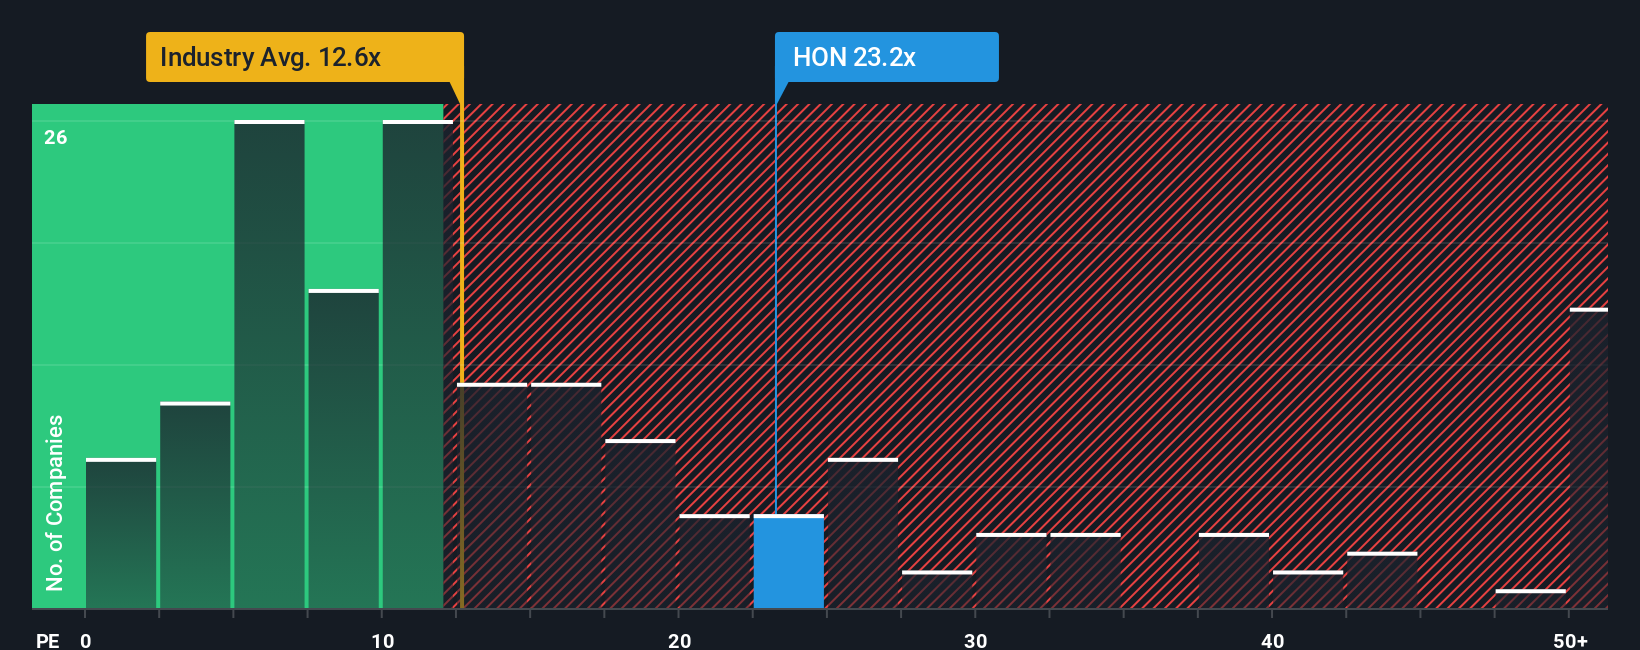
Honeywell currently trades on a P/E of 20.29x. That sits above the wider Industrials sector average of about 12.08x, but below the peer group average of 29.01x. Simply Wall St also calculates a “Fair Ratio” of 28.97x, which reflects what P/E might make sense after accounting for factors such as Honeywell’s earnings profile, industry, profit margins, market cap and risk characteristics.
This Fair Ratio can be more insightful than a straight peer or industry comparison because it adjusts for company specific traits rather than assuming all industrial stocks deserve the same multiple. Compared with the Fair Ratio of 28.97x, Honeywell’s current 20.29x P/E suggests the shares trade below this adjusted benchmark.
Result: UNDERVALUED based on this P/E comparison
P/E ratios tell one story, but what if the real opportunity lies elsewhere? Discover 1464 companies where insiders are betting big on explosive growth.
Upgrade Your Decision Making: Choose your Honeywell International Narrative
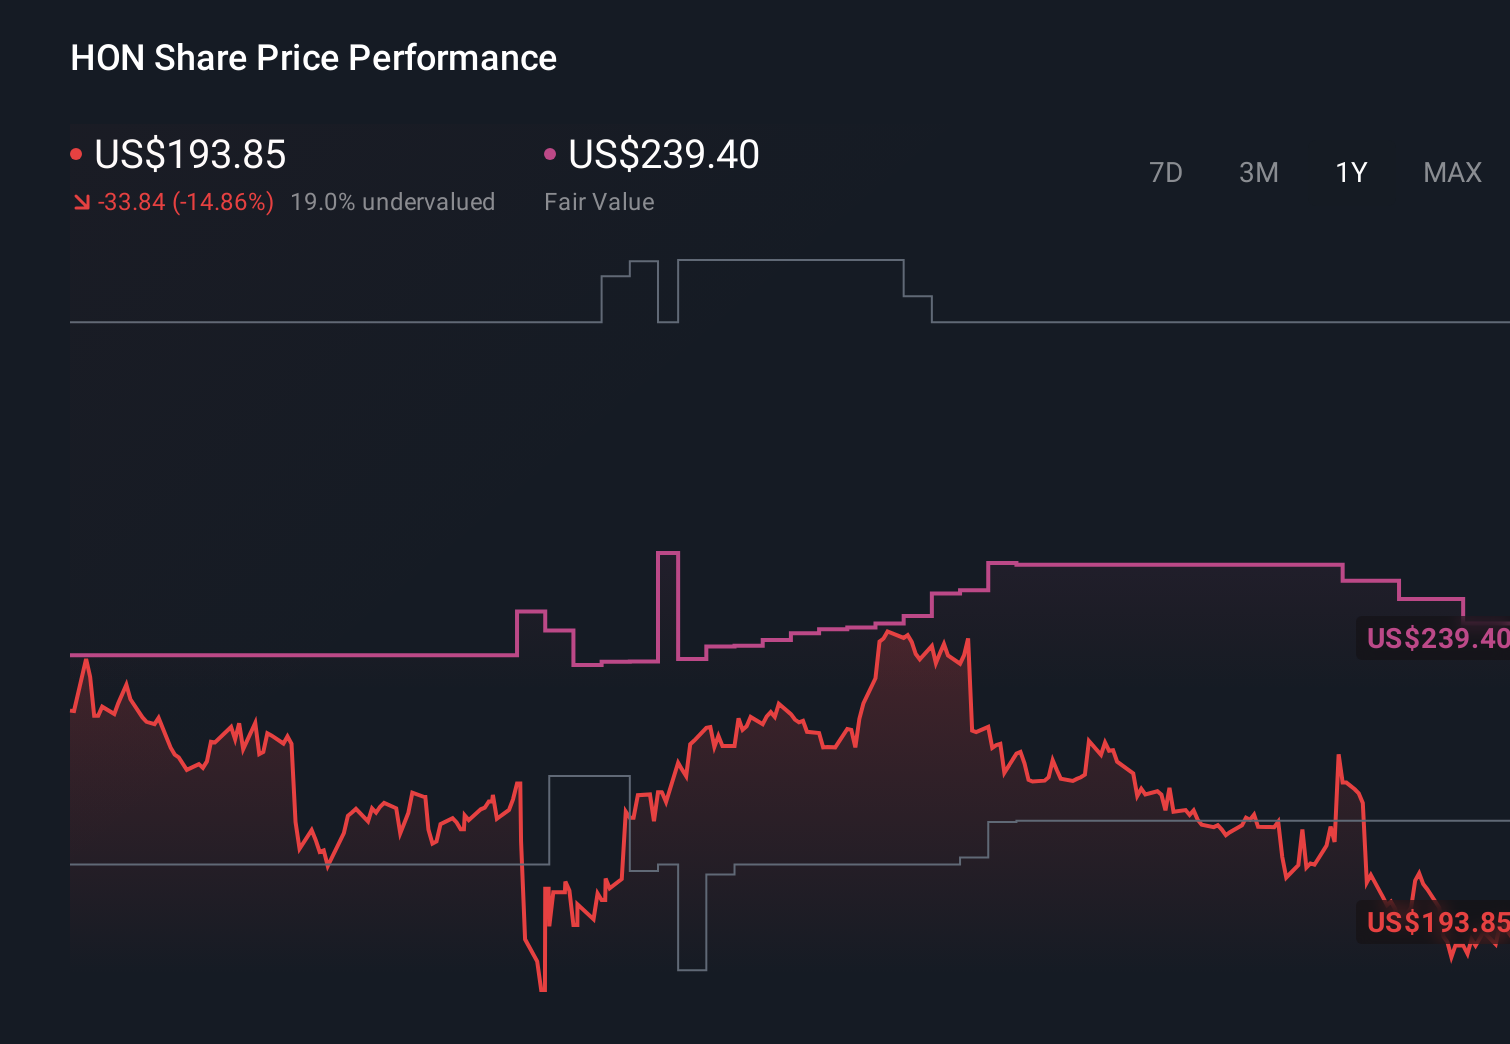
Earlier we mentioned that there is an even better way to understand valuation, so let us introduce you to Narratives, which let you set out your own story for Honeywell International, link that story to a simple forecast for revenue, earnings and margins, and arrive at a Fair Value you can compare with the current share price. This is all available within an accessible tool on Simply Wall St's Community page that updates as new news or earnings arrive and can reflect very different views. For example, one investor might build a Narrative around a higher Fair Value of about US$239.40 tied to separation and growth plans, while another might anchor on a lower Fair Value of about US$203.00 based on tariff and execution risks.
Do you think there's more to the story for Honeywell International? Head over to our Community to see what others are saying!
This article by Simply Wall St is general in nature. We provide commentary based on historical data and analyst forecasts only using an unbiased methodology and our articles are not intended to be financial advice. It does not constitute a recommendation to buy or sell any stock, and does not take account of your objectives, or your financial situation. We aim to bring you long-term focused analysis driven by fundamental data. Note that our analysis may not factor in the latest price-sensitive company announcements or qualitative material. Simply Wall St has no position in any stocks mentioned.
Have feedback on this article? Concerned about the content? Get in touch with us directly. Alternatively, email editorial-team@simplywallst.com