
- PREMIUM
- LIVE QUOTES
- INSTITUTIONS
 Index Options
 State Street
 CME Group
 Nasdaq
 Cboe
Cboe TradingView
 Wall Street Journal
Terreno Realty (TRNO) Valuation Check After New Lease Wins And Redevelopment Moves
Terreno Realty (TRNO) has been active on the real estate front, securing a full-property lease on a redeveloped industrial building in Long Island City and clearing long-term encumbrances on key parcels in New Jersey and California.
See our latest analysis for Terreno Realty.
These leasing and redevelopment moves come as Terreno Realty’s share price sits at $59.02, with recent 30 day and 7 day share price returns slightly negative, while the 1 year, 3 year and 5 year total shareholder returns of 3.63%, 10.77% and 21.89% indicate steadier performance over longer periods.
If you are comparing Terreno’s footprint with other real asset plays, it can help to widen the net and see what stands out among fast growing stocks with high insider ownership.
With Terreno trading at $59.02 and signals like an indicated intrinsic discount and a gap to analyst targets, the key question is whether the recent leasing wins still leave upside on the table or if potential future growth is already reflected in the price.
Price to Earnings of 19.1x: Is it justified?
On a P/E of 19.1x at a share price of $59.02, Terreno Realty screens as cheaper than its direct peers yet a little richer than the broader Industrial REIT group.
The P/E ratio compares what you pay today for each dollar of current earnings. For a REIT like Terreno, which investors often assess on earnings power and income, this is a commonly watched gauge of how the market is pricing those profits.
Terreno is described as good value versus its peers on 31.8x and also below an estimated fair P/E of 23.9x. This suggests the current multiple is not stretched relative to companies with similar profiles. At the same time, the P/E sits above the global Industrial REITs average of 17.1x, so the market is assigning a premium to Terreno compared with the wider group.
The premium to the industry and discount to both peers and the fair P/E estimate point to a middle ground. Valuations could move closer to the fair ratio level over time.
Explore the SWS fair ratio for Terreno Realty
Result: Price-to-earnings of 19.1x (UNDERVALUED)
However, you should keep an eye on the recent 21.79% net income contraction and any slowdown in the 11.23% revenue growth, as these factors could challenge the current valuation story.
Find out about the key risks to this Terreno Realty narrative.
Another View: What Does The DCF Say?
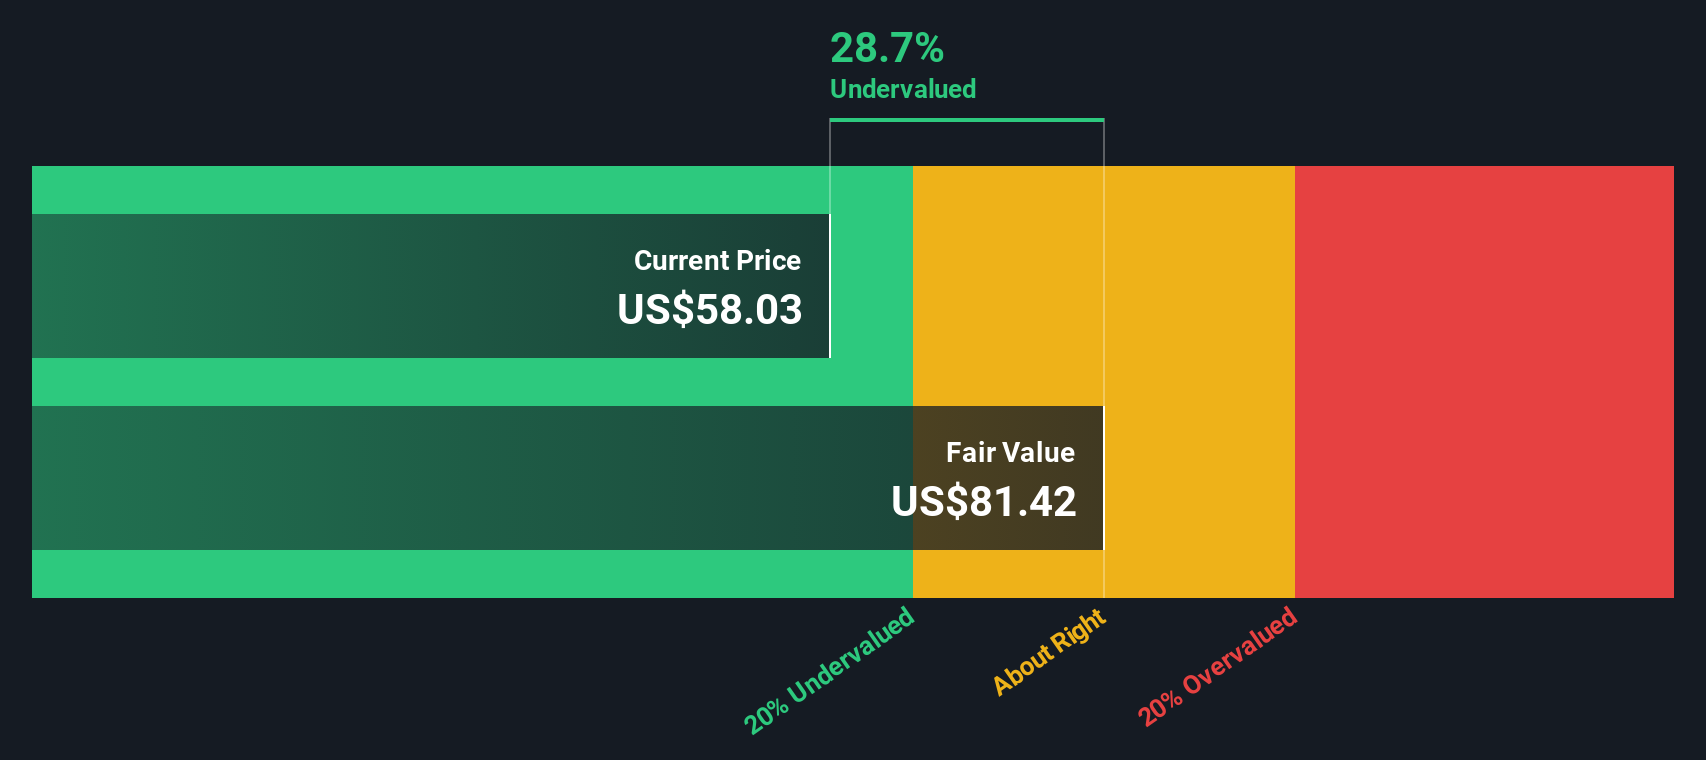
Terreno looks inexpensive on its 19.1x P/E, and our DCF model also points to value, with the shares trading about 11.5% below an estimated fair value of US$66.67. When both earnings and cash flow lenses lean the same way, the key question is what risk or catalyst might close that gap.
Look into how the SWS DCF model arrives at its fair value.
Simply Wall St performs a discounted cash flow (DCF) on every stock in the world every day (check out Terreno Realty for example). We show the entire calculation in full. You can track the result in your watchlist or portfolio and be alerted when this changes, or use our stock screener to discover 867 undervalued stocks based on their cash flows. If you save a screener we even alert you when new companies match - so you never miss a potential opportunity.
Build Your Own Terreno Realty Narrative
If you see the numbers differently or prefer to weigh the data on your own terms, you can build a custom view in minutes. Do it your way.
A great starting point for your Terreno Realty research is our analysis highlighting 4 key rewards and 2 important warning signs that could impact your investment decision.
Ready for more investment ideas?
If Terreno has caught your attention, do not stop here. The wider market holds plenty of other ideas that could suit your style and goals.
- Spot potential value opportunities early by scanning these 867 undervalued stocks based on cash flows, which currently price in more conservative expectations than their cash flow profiles might suggest.
- Back bold technology themes by reviewing these 25 AI penny stocks, which are shaping how artificial intelligence filters into everyday products and services.
- Lean into income-focused opportunities by sorting through these 14 dividend stocks with yields > 3%, which aim to pair yield with underlying business quality.
This article by Simply Wall St is general in nature. We provide commentary based on historical data and analyst forecasts only using an unbiased methodology and our articles are not intended to be financial advice. It does not constitute a recommendation to buy or sell any stock, and does not take account of your objectives, or your financial situation. We aim to bring you long-term focused analysis driven by fundamental data. Note that our analysis may not factor in the latest price-sensitive company announcements or qualitative material. Simply Wall St has no position in any stocks mentioned.
Have feedback on this article? Concerned about the content? Get in touch with us directly. Alternatively, email editorial-team@simplywallst.com