
- PREMIUM
- LIVE QUOTES
- INSTITUTIONS
 Index Options
 State Street
 CME Group
 Nasdaq
 Cboe
Cboe TradingView
 Wall Street Journal
MDA Space (TSX:MDA) Valuation Check After CAD 250 Million Debt Refinancing
MDA Space (TSX:MDA) has completed a CAD 250 million private placement of 7.00% senior unsecured notes due 2030. The company is using the proceeds to refinance its existing credit facility, a move closely watched by equity investors.
See our latest analysis for MDA Space.
The refinancing news lands after a mixed stretch for the shares, with a 1 month share price return of 10.96% but a 90 day share price return showing a 21.30% decline, while the 3 year total shareholder return of about 3.4x signals that longer term momentum has been strong even as sentiment has cooled recently.
If this kind of funding move has you thinking about where else capital is flowing in space and defense, it could be a good moment to scan aerospace and defense stocks for other ideas.
With the refinancing now in place and shares up over the past month but weaker over the past year, the key question is whether MDA Space is still trading at a discount or if the market already reflects its future growth.
Most Popular Narrative: 31.2% Undervalued
With MDA Space closing at CA$27.63 against a narrative fair value of CA$40.19, the current share price sits well below that estimate, which hinges on robust growth and premium earnings multiples continuing to hold.
The ramp-up of large LEO constellation contracts, including the landmark $1.8 billion EchoStar direct-to-device satellite order with options to expand, and multiple pipeline opportunities in broadband, defense, and IoT, is expected to drive robust multi-year revenue growth as global demand for satellite connectivity accelerates.
Want to see what justifies paying up for future profits here? The narrative leans on faster revenue gains, thicker margins, and a richer earnings multiple than many traditional space hardware peers. Curious how those moving parts combine to reach that fair value and what has to go right for the story to hold together? Read on to see how the full narrative connects the dots.
Result: Fair Value of $40.19 (UNDERVALUED)
Have a read of the narrative in full and understand what's behind the forecasts.
However, the story can change quickly if large constellation orders are delayed or if heavy capital spending and acquisitions weigh on margins more than analysts anticipate.
Find out about the key risks to this MDA Space narrative.
Another View: When DCF Says the Opposite
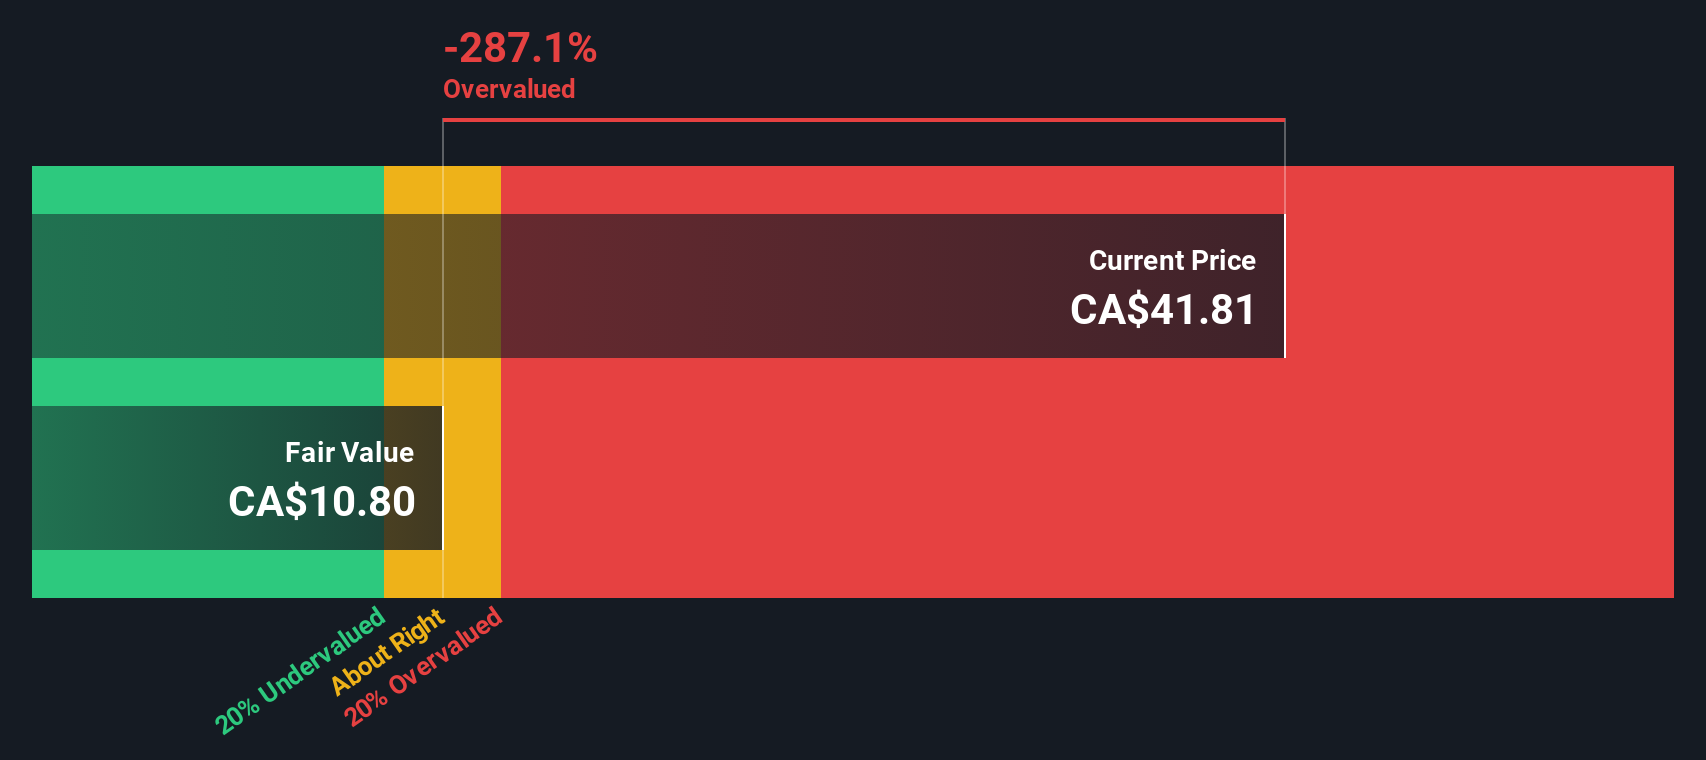
There is a twist when you line up the story-driven fair value of CA$40.19 with our DCF model. On that framework, MDA Space, at CA$27.63, screens as expensive versus an estimated fair value of CA$5.71, which points to a very different risk and return balance.
The gap is wide enough that it raises a practical question for you as an investor. Are the growth and margin assumptions in the narrative strong enough to justify paying several times what the DCF suggests, or is it worth taking a closer look at the cash flow math before you commit fresh capital?
Look into how the SWS DCF model arrives at its fair value.
Simply Wall St performs a discounted cash flow (DCF) on every stock in the world every day (check out MDA Space for example). We show the entire calculation in full. You can track the result in your watchlist or portfolio and be alerted when this changes, or use our stock screener to discover 867 undervalued stocks based on their cash flows. If you save a screener we even alert you when new companies match - so you never miss a potential opportunity.
Build Your Own MDA Space Narrative
If you see the numbers differently or prefer to test the assumptions yourself, you can create a custom view in minutes, Do it your way.
A good starting point is our analysis highlighting 3 key rewards investors are optimistic about regarding MDA Space.
Ready For More Investment Ideas?
If MDA Space has sparked your interest, do not stop here. The next strong idea you find could come from looking beyond a single stock.
- Spot potential value opportunities early by scanning these 867 undervalued stocks based on cash flows and seeing which companies currently trade below their cash flow based estimates.
- Tap into cutting edge themes by checking out these 25 AI penny stocks that are tied to real business models rather than just headlines.
- Strengthen your income side by reviewing these 14 dividend stocks with yields > 3% that offer yields above 3% with room for further analysis on sustainability.
This article by Simply Wall St is general in nature. We provide commentary based on historical data and analyst forecasts only using an unbiased methodology and our articles are not intended to be financial advice. It does not constitute a recommendation to buy or sell any stock, and does not take account of your objectives, or your financial situation. We aim to bring you long-term focused analysis driven by fundamental data. Note that our analysis may not factor in the latest price-sensitive company announcements or qualitative material. Simply Wall St has no position in any stocks mentioned.
Have feedback on this article? Concerned about the content? Get in touch with us directly. Alternatively, email editorial-team@simplywallst.com