
- PREMIUM
- LIVE QUOTES
- INSTITUTIONS
 Index Options
 State Street
 CME Group
 Nasdaq
 Cboe
Cboe TradingView
 Wall Street Journal
Assessing CRISPR Therapeutics (CRSP) Valuation As Investor Interest Returns
Why CRISPR Therapeutics is back on investors’ radar
CRISPR Therapeutics (CRSP) has come back into focus after recent trading, with the share price at US$53.77 and mixed returns over the past week, month, and past 3 months catching investors’ attention.
See our latest analysis for CRISPR Therapeutics.
At a share price of US$53.77, CRISPR Therapeutics has seen momentum cool in recent months, with a 90 day share price return of 23.86% and a contrasting 1 year total shareholder return of 26.73%, which sits against a weaker 5 year total shareholder return of 71.53%.
If gene editing has you looking beyond a single name, it could be a good moment to compare CRISPR Therapeutics with other healthcare stocks that might fit your watchlist next.
With a recent 90 day share price decline of 23.86% and a 1 year total return of 26.73%, along with an indicated intrinsic discount of 72.44%, investors may reasonably ask whether there is genuine upside or whether the market is already pricing in future growth.
Price to book of 2.7x, is it justified?
CRISPR Therapeutics currently trades on a P/B of 2.7x compared with a peer average of 21.4x, yet sits roughly in line with the broader US biotech industry at 2.7x. This sends very different signals depending on which comparison you focus on.
P/B compares a company’s market value to its net assets. This can be useful for early stage or unprofitable biotech names where earnings based metrics like P/E are less helpful. For CRISPR Therapeutics, this lens sits alongside a company that is still loss making, with net income of a loss of US$488.3 million on revenue of US$38.3 million, and is forecast to remain unprofitable over the next three years.
Against its direct peer group average of 21.4x, a 2.7x P/B suggests the market is attaching a far lower valuation to each dollar of CRISPR Therapeutics’ equity value than to peers. However, compared with the US biotech industry average P/B of 2.7x, the shares look broadly in line. This points to investors pricing the company similarly to the sector overall despite its specific forecasts and risk profile.
See what the numbers say about this price — find out in our valuation breakdown.
Result: Preferred multiple of 2.7x price to book (UNDERVALUED versus peers, ABOUT RIGHT versus industry)
However, there are clear pressure points, including ongoing losses of US$488.3 million on revenue of US$38.3 million, as well as the risk that key pipeline programs face clinical or regulatory setbacks.
Find out about the key risks to this CRISPR Therapeutics narrative.
Another way to look at CRISPR Therapeutics’ value
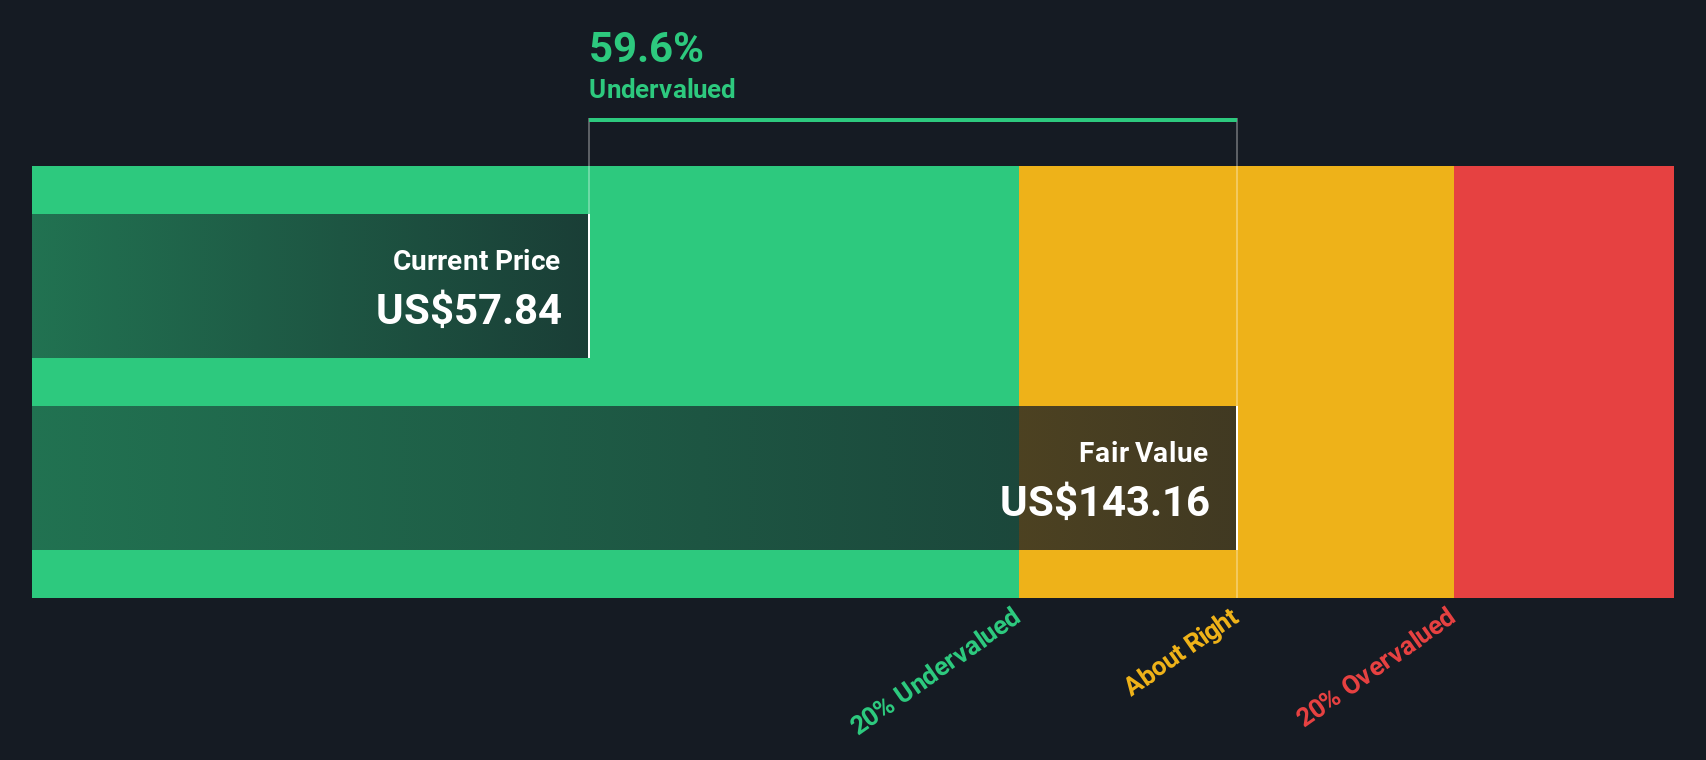
While the current 2.7x P/B against a 21.4x peer average hints at a cheaper entry point, our discounted cash flow work paints an even starker picture, with the shares trading 72.4% below an estimated fair value of US$195.07. If both are right, it may be useful for investors to consider how long that gap could persist.
Look into how the SWS DCF model arrives at its fair value.
Simply Wall St performs a discounted cash flow (DCF) on every stock in the world every day (check out CRISPR Therapeutics for example). We show the entire calculation in full. You can track the result in your watchlist or portfolio and be alerted when this changes, or use our stock screener to discover 867 undervalued stocks based on their cash flows. If you save a screener we even alert you when new companies match - so you never miss a potential opportunity.
Build Your Own CRISPR Therapeutics Narrative
If you see the numbers differently or prefer to rely on your own view, you can build a custom thesis in just a few minutes, starting with Do it your way.
A great starting point for your CRISPR Therapeutics research is our analysis highlighting 2 key rewards and 1 important warning sign that could impact your investment decision.
Looking for more investment ideas?
If CRISPR Therapeutics has sparked your interest, do not stop here. Use the screeners below to spot other opportunities that could complement your watchlist.
- Target income potential by scanning for companies offering meaningful yields through these 14 dividend stocks with yields > 3% that might suit a cash flow focused portfolio.
- Zero in on opportunities trading below estimated worth with these 867 undervalued stocks based on cash flows and see which names stand out on valuation grounds.
- Position yourself early in emerging themes with these 79 cryptocurrency and blockchain stocks tied to digital assets and blockchain related business models.
This article by Simply Wall St is general in nature. We provide commentary based on historical data and analyst forecasts only using an unbiased methodology and our articles are not intended to be financial advice. It does not constitute a recommendation to buy or sell any stock, and does not take account of your objectives, or your financial situation. We aim to bring you long-term focused analysis driven by fundamental data. Note that our analysis may not factor in the latest price-sensitive company announcements or qualitative material. Simply Wall St has no position in any stocks mentioned.
Have feedback on this article? Concerned about the content? Get in touch with us directly. Alternatively, email editorial-team@simplywallst.com