
- PREMIUM
- LIVE QUOTES
- INSTITUTIONS
 Index Options
 State Street
 CME Group
 Nasdaq
 Cboe
Cboe TradingView
 Wall Street Journal
BlackBerry (TSX:BB) Valuation Check After Mixed Q3 Results And QNX Slowdown Concerns
BlackBerry (TSX:BB) is back in focus after mixed fiscal Q3 2026 results that beat revenue and EPS estimates, came with higher full year guidance, and highlighted fresh questions around its QNX automotive software platform.
See our latest analysis for BlackBerry.
The mixed Q3 update and higher guidance come after a tougher run for the stock, with a 30 day share price return of 12.56% decline and a 1 year total shareholder return of 10.92% decline. However, the 3 year total shareholder return of 12.26% gain suggests longer term momentum has been steadier than the recent QNX related concerns might imply.
If BlackBerry's story has you rethinking where software and security fit in your portfolio, this could be a good moment to check out high growth tech and AI stocks as potential next ideas.
With BlackBerry trading close to analyst targets yet screening with a value score of 1 and an estimated 15.66% intrinsic discount, you have to ask yourself: is there hidden upside here, or is the market already pricing in future growth?
Price to Earnings of 106.3x: Is it justified?
On earnings, BlackBerry trades on a P/E of 106.3x at a last close of CA$5.22, which screens as expensive relative to both peers and its own fair ratio.
The P/E multiple compares the current share price to earnings per share and is a quick shorthand for how much investors are paying for each dollar of profit. For a software and security name like BlackBerry, a higher P/E often reflects expectations for future earnings strength rather than current profitability.
In this case, the P/E of 106.3x is well above the estimated fair P/E of 35.3x, which suggests the market is assigning a much richer earnings multiple than that fair ratio estimate points to. That gap implies investors are paying a premium that could compress if sentiment or earnings expectations change.
Against the Canadian Software industry average P/E of 47.1x, BlackBerry is also priced at a substantially higher earnings multiple, so it is not only above its own estimated fair ratio but also carries a premium versus sector peers.
Explore the SWS fair ratio for BlackBerry
Result: Price to Earnings of 106.3x (OVERVALUED)
However, you still have to weigh the risk that QNX related uncertainty and BlackBerry's high P/E leave little room for disappointment in execution or sentiment.
Find out about the key risks to this BlackBerry narrative.
Another View: DCF Says The Price Is Cheaper Than It Looks
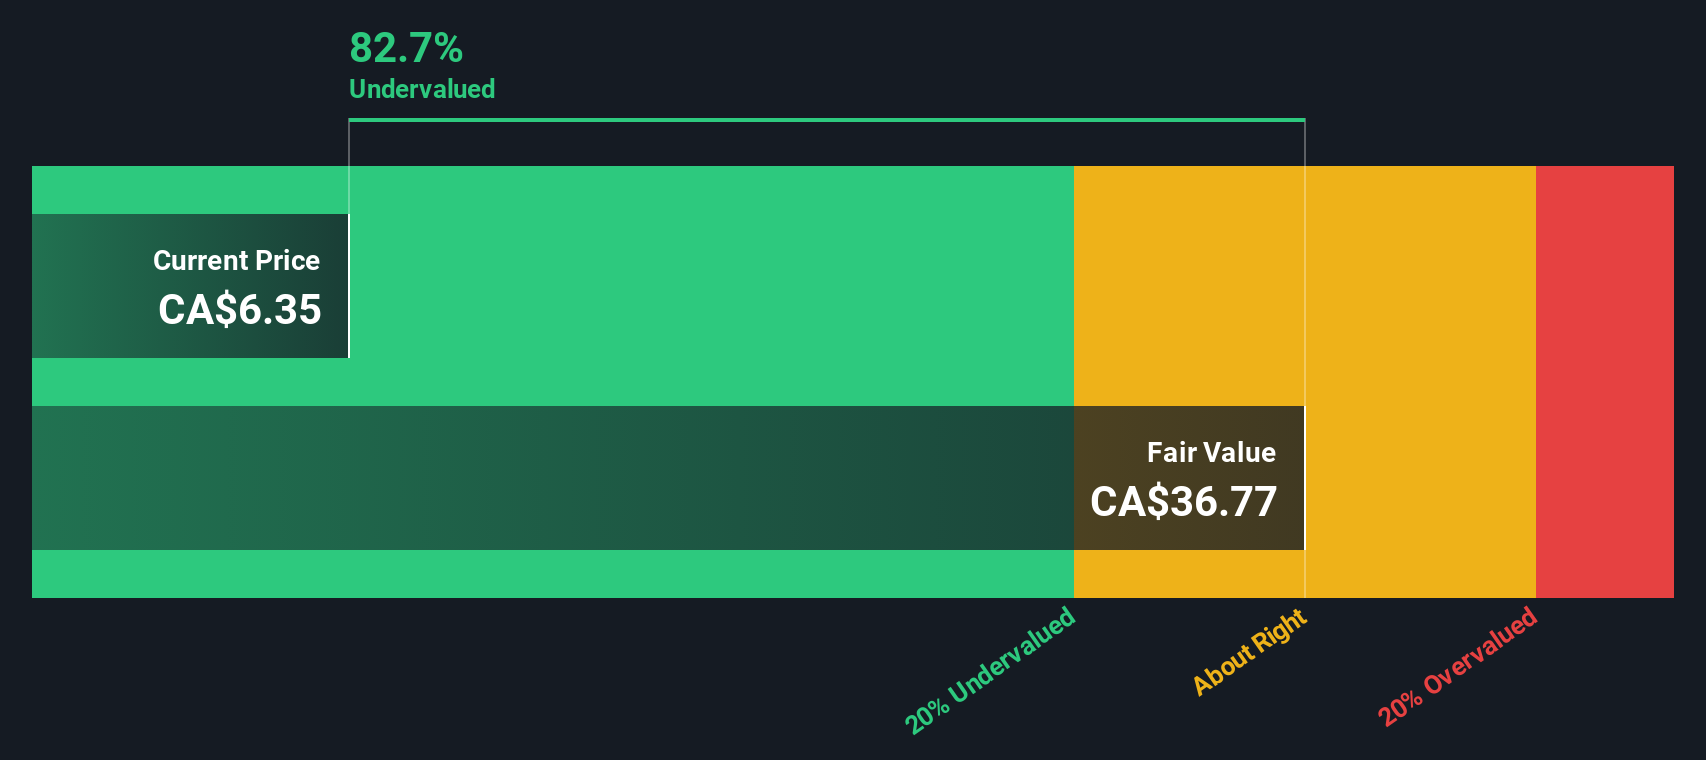
While the 106.3x P/E suggests BlackBerry is expensive, our DCF model points in the opposite direction. At CA$5.22, the shares are trading about 15.7% below an estimated fair value of CA$6.19. This frames the current price as a potential discount rather than a premium. So which signal matters more for you: earnings multiple or cash flow value?
Look into how the SWS DCF model arrives at its fair value.
Simply Wall St performs a discounted cash flow (DCF) on every stock in the world every day (check out BlackBerry for example). We show the entire calculation in full. You can track the result in your watchlist or portfolio and be alerted when this changes, or use our stock screener to discover 875 undervalued stocks based on their cash flows. If you save a screener we even alert you when new companies match - so you never miss a potential opportunity.
Build Your Own BlackBerry Narrative
If this view does not quite match your perspective, or you prefer to test the numbers yourself, you can build your own narrative in minutes, starting with Do it your way.
A great starting point for your BlackBerry research is our analysis highlighting 3 key rewards and 1 important warning sign that could impact your investment decision.
Looking for more investment ideas?
If you are reassessing where BlackBerry fits, do not stop here. Broaden your watchlist with focused stock ideas that match how you like to invest.
- Zero in on value by checking out these 875 undervalued stocks based on cash flows that align with your preference for paying less for future cash flows.
- Chase growth stories by reviewing these 25 AI penny stocks shaping the future of automation, data, and machine learning.
- Add diversification by scanning these 79 cryptocurrency and blockchain stocks tied to blockchain, digital payments, and wider cryptocurrency themes.
This article by Simply Wall St is general in nature. We provide commentary based on historical data and analyst forecasts only using an unbiased methodology and our articles are not intended to be financial advice. It does not constitute a recommendation to buy or sell any stock, and does not take account of your objectives, or your financial situation. We aim to bring you long-term focused analysis driven by fundamental data. Note that our analysis may not factor in the latest price-sensitive company announcements or qualitative material. Simply Wall St has no position in any stocks mentioned.
Have feedback on this article? Concerned about the content? Get in touch with us directly. Alternatively, email editorial-team@simplywallst.com