
- PREMIUM
- LIVE QUOTES
- INSTITUTIONS
 Index Options
 State Street
 CME Group
 Nasdaq
 Cboe
Cboe TradingView
 Wall Street Journal
FireFly Metals (ASX:FFM): Has the Recent Share Price Surge Outrun Its Valuation?
FireFly Metals (ASX:FFM) has quietly turned into one of the stronger movers on the ASX, with the share price up roughly 59% over the past 3 months and more than doubling over the past year.
See our latest analysis for FireFly Metals.
That momentum is not just a short blip either. The 30 day share price return of 14.44% builds on a strong 90 day move of 59.07%, while the 1 year total shareholder return sits above 130%, suggesting investors are steadily repricing FireFly s growth prospects and risk profile.
If FireFly s run has caught your attention, it could be a good moment to broaden your search and discover fast growing stocks with high insider ownership.
With analysts seeing little upside to the current price and valuation models suggesting only a modest intrinsic discount, investors now face a key question: Is FireFly undervalued, or is the market already pricing in its future growth?
Price to Book of 4.9x: Is it justified?
On a price to book basis, FireFly Metals looks expensive at A$2.06 per share compared to both its industry and peer averages.
The price to book ratio compares a company s market value with the net value of its assets, a common yardstick for asset heavy miners and explorers. For a business that is still unprofitable and effectively pre revenue, a richer multiple usually reflects confidence in the quality and potential of its underlying projects rather than current earnings power.
In FireFly s case, investors are paying around 4.9 times book value, which is almost double the Australian Metals and Mining industry average of 2.5 times and slightly above the 4.8 times peer average. That premium suggests the market is assigning a higher probability of exploration success and future cash flows than it does for typical sector names.
See what the numbers say about this price — find out in our valuation breakdown.
Result: Price to Book of 4.9x (OVERVALUED)
However, FireFly remains pre revenue with ongoing losses, so any setback at its Green Bay project or funding challenges could quickly puncture market optimism.
Find out about the key risks to this FireFly Metals narrative.
Another Way to Look at Value
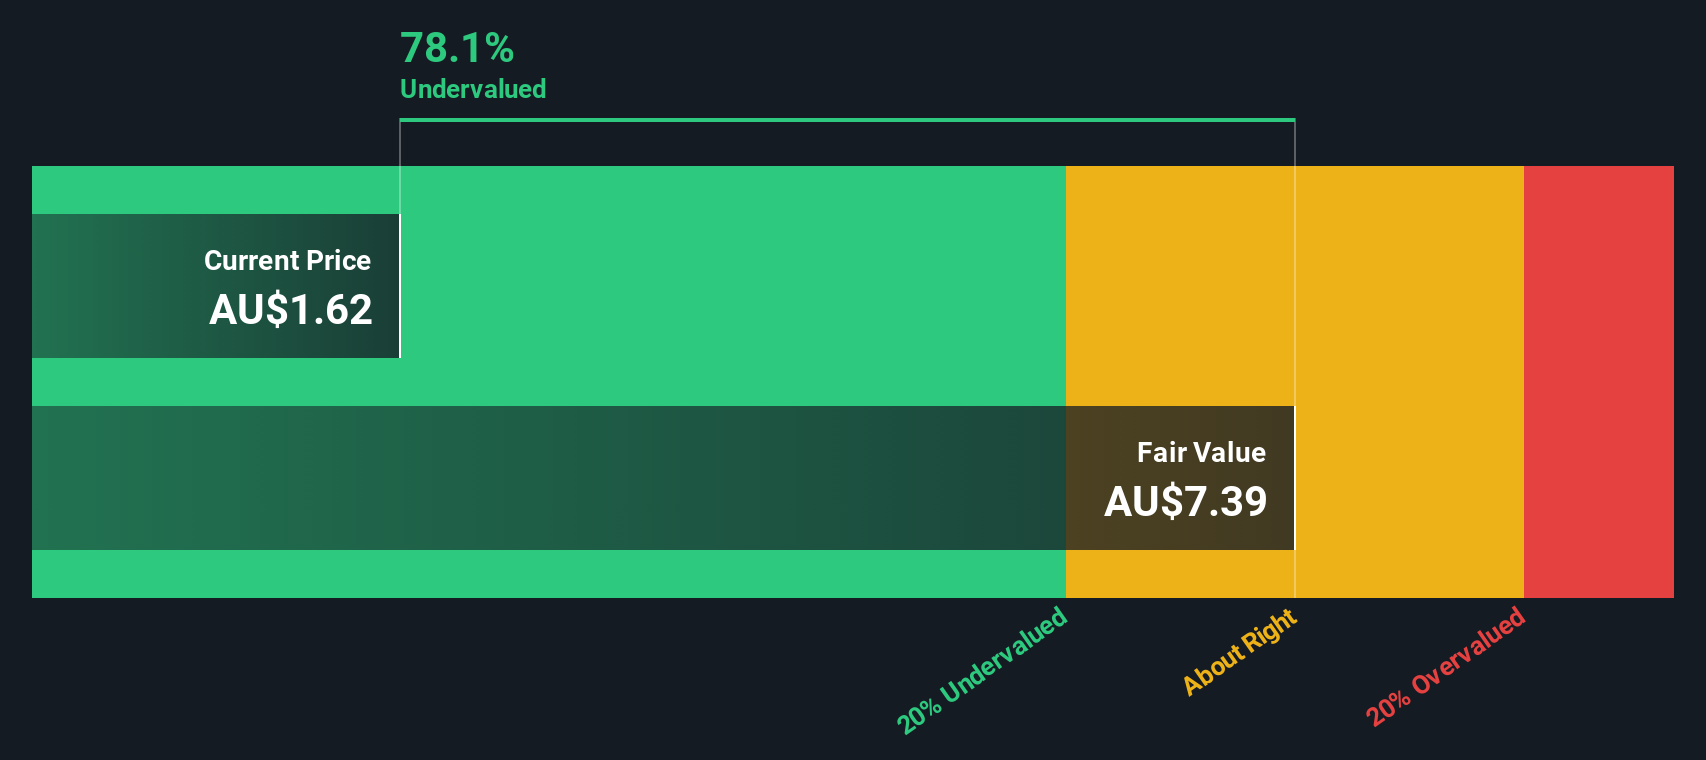
While FireFly screens as expensive on price to book, our DCF model tells a very different story. On those cash flow assumptions, FireFly looks deeply undervalued, trading at barely 5 percent of our estimated fair value. Is the market missing something, or is the model too optimistic?
Look into how the SWS DCF model arrives at its fair value.
Simply Wall St performs a discounted cash flow (DCF) on every stock in the world every day (check out FireFly Metals for example). We show the entire calculation in full. You can track the result in your watchlist or portfolio and be alerted when this changes, or use our stock screener to discover 875 undervalued stocks based on their cash flows. If you save a screener we even alert you when new companies match - so you never miss a potential opportunity.
Build Your Own FireFly Metals Narrative
If you see the story differently or want to dig into the numbers yourself, you can build a personalised view in minutes: Do it your way.
A great starting point for your FireFly Metals research is our analysis highlighting 1 key reward and 3 important warning signs that could impact your investment decision.
Ready for more high conviction ideas?
FireFly might just be the beginning. Use the Simply Wall St Screener now to uncover fresh opportunities before the crowd races ahead of you.
- Capture potential bargains early by targeting companies trading below their estimated cash flow value through these 875 undervalued stocks based on cash flows.
- Tap into cutting edge innovation by zeroing in on firms riding the artificial intelligence wave using these 25 AI penny stocks.
- Strengthen your income stream by focusing on reliable payers with attractive yields via these 14 dividend stocks with yields > 3%.
This article by Simply Wall St is general in nature. We provide commentary based on historical data and analyst forecasts only using an unbiased methodology and our articles are not intended to be financial advice. It does not constitute a recommendation to buy or sell any stock, and does not take account of your objectives, or your financial situation. We aim to bring you long-term focused analysis driven by fundamental data. Note that our analysis may not factor in the latest price-sensitive company announcements or qualitative material. Simply Wall St has no position in any stocks mentioned.
Have feedback on this article? Concerned about the content? Get in touch with us directly. Alternatively, email editorial-team@simplywallst.com