
- PREMIUM
- LIVE QUOTES
- INSTITUTIONS
 Index Options
 State Street
 CME Group
 Nasdaq
 Cboe
Cboe TradingView
 Wall Street Journal
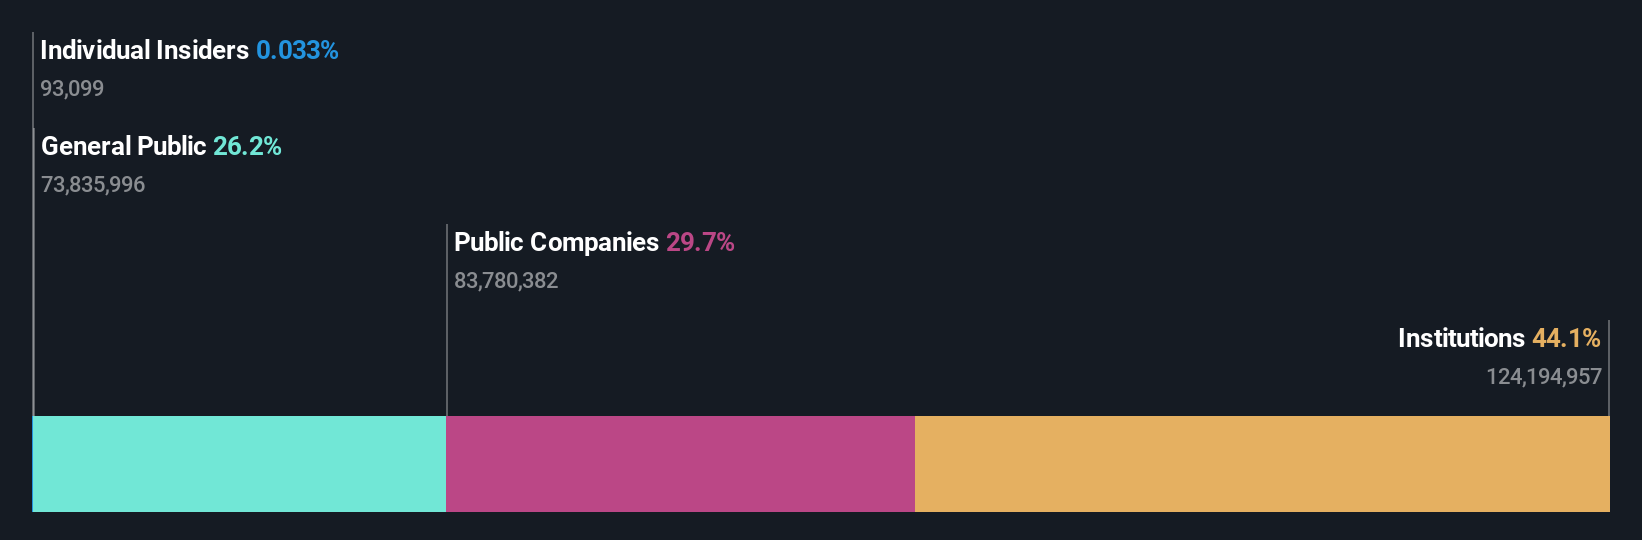
Fresenius Medical Care AG (ETR:FME) is favoured by institutional owners who hold 44% of the company
Key Insights
- Significantly high institutional ownership implies Fresenius Medical Care's stock price is sensitive to their trading actions
- A total of 6 investors have a majority stake in the company with 52% ownership
- Using data from analyst forecasts alongside ownership research, one can better assess the future performance of a company
A look at the shareholders of Fresenius Medical Care AG (ETR:FME) can tell us which group is most powerful. We can see that institutions own the lion's share in the company with 44% ownership. Put another way, the group faces the maximum upside potential (or downside risk).
Because institutional owners have a huge pool of resources and liquidity, their investing decisions tend to carry a great deal of weight, especially with individual investors. As a result, a sizeable amount of institutional money invested in a firm is generally viewed as a positive attribute.
Let's delve deeper into each type of owner of Fresenius Medical Care, beginning with the chart below.
See our latest analysis for Fresenius Medical Care
What Does The Institutional Ownership Tell Us About Fresenius Medical Care?
Institutional investors commonly compare their own returns to the returns of a commonly followed index. So they generally do consider buying larger companies that are included in the relevant benchmark index.
As you can see, institutional investors have a fair amount of stake in Fresenius Medical Care. This can indicate that the company has a certain degree of credibility in the investment community. However, it is best to be wary of relying on the supposed validation that comes with institutional investors. They too, get it wrong sometimes. If multiple institutions change their view on a stock at the same time, you could see the share price drop fast. It's therefore worth looking at Fresenius Medical Care's earnings history below. Of course, the future is what really matters.

Hedge funds don't have many shares in Fresenius Medical Care. Looking at our data, we can see that the largest shareholder is Fresenius SE & Co. KGaA with 30% of shares outstanding. Dodge & Cox is the second largest shareholder owning 5.9% of common stock, and Pzena Investment Management, Inc. holds about 5.0% of the company stock.
We also observed that the top 6 shareholders account for more than half of the share register, with a few smaller shareholders to balance the interests of the larger ones to a certain extent.
While it makes sense to study institutional ownership data for a company, it also makes sense to study analyst sentiments to know which way the wind is blowing. Quite a few analysts cover the stock, so you could look into forecast growth quite easily.
Insider Ownership Of Fresenius Medical Care
The definition of an insider can differ slightly between different countries, but members of the board of directors always count. The company management answer to the board and the latter should represent the interests of shareholders. Notably, sometimes top-level managers are on the board themselves.
Insider ownership is positive when it signals leadership are thinking like the true owners of the company. However, high insider ownership can also give immense power to a small group within the company. This can be negative in some circumstances.
Our most recent data indicates that insiders own less than 1% of Fresenius Medical Care AG. It is a very large company, so it would be surprising to see insiders own a large proportion of the company. Though their holding amounts to less than 1%, we can see that board members collectively own €3.7m worth of shares (at current prices). Arguably recent buying and selling is just as important to consider. You can click here to see if insiders have been buying or selling.
General Public Ownership
With a 26% ownership, the general public, mostly comprising of individual investors, have some degree of sway over Fresenius Medical Care. While this group can't necessarily call the shots, it can certainly have a real influence on how the company is run.
Public Company Ownership
Public companies currently own 30% of Fresenius Medical Care stock. We can't be certain but it is quite possible this is a strategic stake. The businesses may be similar, or work together.
Next Steps:
It's always worth thinking about the different groups who own shares in a company. But to understand Fresenius Medical Care better, we need to consider many other factors. Be aware that Fresenius Medical Care is showing 2 warning signs in our investment analysis , you should know about...
If you would prefer discover what analysts are predicting in terms of future growth, do not miss this free report on analyst forecasts.
NB: Figures in this article are calculated using data from the last twelve months, which refer to the 12-month period ending on the last date of the month the financial statement is dated. This may not be consistent with full year annual report figures.
Have feedback on this article? Concerned about the content? Get in touch with us directly. Alternatively, email editorial-team (at) simplywallst.com.
This article by Simply Wall St is general in nature. We provide commentary based on historical data and analyst forecasts only using an unbiased methodology and our articles are not intended to be financial advice. It does not constitute a recommendation to buy or sell any stock, and does not take account of your objectives, or your financial situation. We aim to bring you long-term focused analysis driven by fundamental data. Note that our analysis may not factor in the latest price-sensitive company announcements or qualitative material. Simply Wall St has no position in any stocks mentioned.